FORUM CTRLX AUTOMATION
ctrlX World Partner Apps for ctrlX AUTOMATION
Dear Community User! We have started the migration process.
This community is now in READ ONLY mode.
Read more: Important
information on the platform change.
- ctrlX AUTOMATION Community
- Forum ctrlX AUTOMATION
- ctrlX PLC
- Re: Display CPU load in the ctrlX PLC Engineering
Display CPU load in the ctrlX PLC Engineering
- Subscribe to RSS Feed
- Mark Topic as New
- Mark Topic as Read
- Float this Topic for Current User
- Bookmark
- Subscribe
- Mute
- Printer Friendly Page
- Mark as New
- Bookmark
- Subscribe
- Mute
- Subscribe to RSS Feed
- Permalink
- Report Inappropriate Content
02-12-2021 09:43 PM
Hello everyone,
I just found this picture in the ctrlX PLC Engineering software manual on page 282. In the attached picture, you can only see graphs of the average PLC load and the PLC load of the three cores. I'm wondering, if it's possible to get more detailled information about the CPU load?
Please let me know, if you know a way to get more detailled information about the CPU load.
Thanks in advance!
Solved! Go to Solution.
- Mark as New
- Bookmark
- Subscribe
- Mute
- Subscribe to RSS Feed
- Permalink
- Report Inappropriate Content
02-15-2021 10:42 AM
Which documentation are you referring to? I found the picture you mentioned in R911403764_01 "ctrlX PLC Engineering" on page 249.
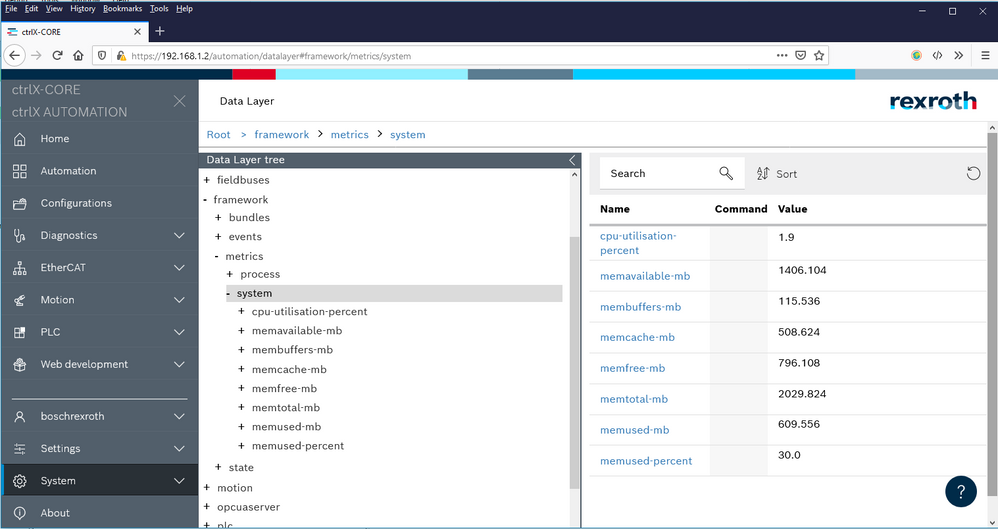
We have to check if this feature is implemented. As far as I know actually you can only read out the sum of all 4 CPU cores via the datalayer:
- Mark as New
- Bookmark
- Subscribe
- Mute
- Subscribe to RSS Feed
- Permalink
- Report Inappropriate Content
02-15-2021 07:14 PM
You can find the picture also in the manual "R911403763_01" on page 271. I tried to recreate the diagram using my own application. Unfortunately without success! But if this feature is not yet implemented, that's an obvious result.
And thank you very much for the information! I didn't know, that you can see the CPU load in the ctrlX Data Layer as well.
- Mark as New
- Bookmark
- Subscribe
- Mute
- Subscribe to RSS Feed
- Permalink
- Report Inappropriate Content
03-03-2021 11:34 AM
Hello,
Device Trace is not supported by ctrlX PLC App. The corresponding documentation has been updated and will be provided soon. With RM21.03 the configuration of Device Trace is not supported any longer within ctrlX PLC Engineering. For diagnostics regarding ctrlX CORE load a central mechanism has to be provided, that can be accessed by Apps and PLC.


