FORUM CTRLX AUTOMATION
ctrlX World Partner Apps for ctrlX AUTOMATION
Dear Community User! We are updating our platform to a new
system.
Read more: Important
information on the platform change.
- ctrlX AUTOMATION Community
- Forum ctrlX AUTOMATION
- ctrlX CORE
- Yellow LED on CtrlX core - is this specific problem beacuse of the disk overflow?
Yellow LED on CtrlX core - is this specific problem beacuse of the disk overflow?
- Subscribe to RSS Feed
- Mark Topic as New
- Mark Topic as Read
- Float this Topic for Current User
- Bookmark
- Subscribe
- Mute
- Printer Friendly Page
- Mark as New
- Bookmark
- Subscribe
- Mute
- Subscribe to RSS Feed
- Permalink
- Report Inappropriate Content
02-21-2023 02:33 PM - edited 02-21-2023 02:35 PM
Hi,
I experience following strange situation.
I developed a node-red application that uses the DL subscriptions nodes and REST/API to monitor parameters of the servo drives. The source of the information for this flow is the DriveConnect App V1.18 which publishes data on DL. I monitor e.g. 7 drives and collect about 10 parameters from each with sampling based on seconds/minutes not ms.
I noticed such strange behavior with the ctrlX core (also on newest firmware V1.18.4).
Short version of the story:
- I run the software on ctrlX core and go home at the afternoon first checking if everything is working fine.
- I can see every day in the morning
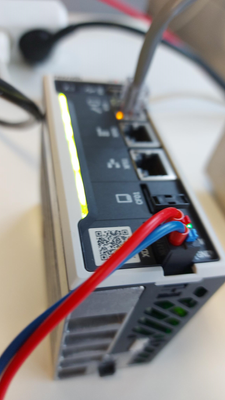
- a yellow led blinking on the ctrlX unit
- ctrlX unit is not responsive (no web gui, no webdav access, no node-red dashboard)
- only ping is working to the unit
- The monitoring of the drives is stopped during the night (in my case between 01:00 – 02:00 AM)
- In the morning I can do only one thing: power down the unit and power it up again
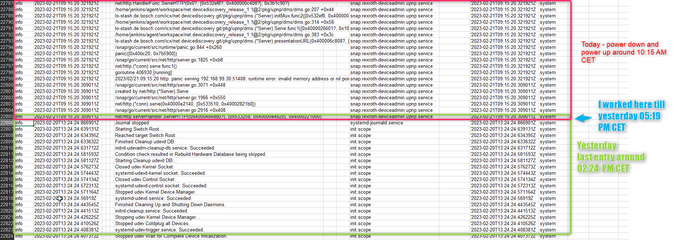
- After power on I can login in (the led is green now) I can see a few hours missing in the logs. I cannot see logs from some time during the day before till the next day time of power down/up procedure. I can see todays messages starting from boot messages – see image.
7 The drive monitoring can be restarted.
8 I recreated same setup on other ctrlX unit and the situation is the same – led is yellow in the morning.
My suspicions:
- The journaling of logs (especially log cleansing) is not working as designed ? – as a result the whole disk space of some partition (log partition or some other?) is consumed and only some services as tcp stack (cause ping is fine) are working and the majority of snaps are soon becoming dead due to low disk for Ubuntu including the ctrlX home page.
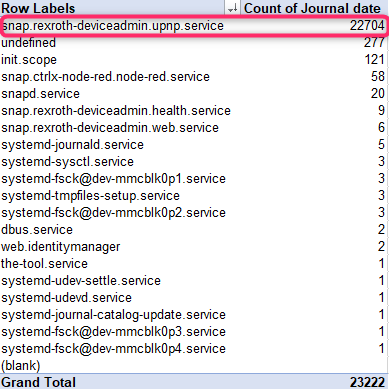
- The UPnP feature of the network discovery generates a lot of info logs. I made a download of the whole log I was able to do from the device and can see that 97% of all downloaded logs are the info messages from the snap.rexroth-deviceadmin.upnp.service. Every 10 seconds there is over 2000 entries from this service. Can it be somehow configurable on the GUI or at least the info log can be limited/discarded?
I attach sample log to this post and below image as summary of log entries
3 I noticed, if you have debug nodes in node-red flow they also generate a lot of logs information to the central log mechanism of the ctrlX - in this case it can also influence on the ctrlX log or disk overflow.
4 The DriveConnect App is developed in a way that is automatically creating DL nodes under /devices/drives for drives discovered in the same network subnet as ctrlX unit - I would assume that DriveConnect App is using the UPnP mechanism for the discovery of the drives. Do you think that maybe here can be a source of huge number of messages from the UPnP protocol?
TLDR version:
- I start my node-red app and drive connect app and monitor the drives. I leave it for a night.
- In the morning when I come to the office I can see that the ctrlX core LED is yellow and:
- The ctrlX unit answers on ping request from my pc
- The home page of the ctrlX is not answering at all – the page is not accessible (nothing on the console and debug in firefox and chrome)
- The WebDAV is not accessible at all.
3 I have no other choice like to unplug the device from the power and plug again.
4 Logs in the ctrlX are having a few hours of missing entries
And here comes another tricky part:
I recreated the same config on the other ctrlX unit I made exactly the same install of the environment and versions: ctrlX firmware, Node-red and drive connect.
And…. the second ctrlX unit behaves exactly the same. It is blinking yellow in the morning
I made another test and restarted both units same time before going home yesterday. And today in the morning they are blinking yellow again and are not reacting until I power them down and up.
I made also one interesting observation: I saved last heart beat of both units from last night. In the node-red there is a flow which collects actual CPU utilization and writes it to the database with actual timestamp. This is done every 5 seconds.
Please see the records form last night:
The units stopped the activity same time around 01:25 AM – difference is 5 seconds between them.
Some may say:
“Ok, there was some power failure in the building during the night (but it wasn’t cause I have a third unit which is working and also some other computers/servers which did not report power down last night ) and maybe the ctrlX units were not powered up properly or some peak power et.c” - but I cannot believe it. As this behavior happens every day to me I would assume this is something wrong with the particular setup or in ctrlX firmware itself ( I am running the newest).
I will try today:
- switch off the UPnP – will see if DriveConnect App will continue to work (I assume not)
- remove all debug nodes from Nod-red flows I created
- will do the test with
- 1st unit without above change implemented and
- the 2nd unit with above changes implemented and let’s see.
Will keep you posted.
Regards,
Kookoolinoo
PS. In general it is fun 😊
Solved! Go to Solution.
- Mark as New
- Bookmark
- Subscribe
- Mute
- Subscribe to RSS Feed
- Permalink
- Report Inappropriate Content
04-14-2023 02:35 PM
Hi Kookoolinoo,
any news here?
Regards
- Mark as New
- Bookmark
- Subscribe
- Mute
- Subscribe to RSS Feed
- Permalink
- Report Inappropriate Content
06-22-2023 12:09 PM
Hi,
So with release 1.20 all problems were gone. Not experiencing this sistuatnion anymore.
🙂


