- Subscribe to RSS Feed
- Mark as New
- Mark as Read
- Bookmark
- Subscribe
- Printer Friendly Page
- Report Inappropriate Content
Introduction
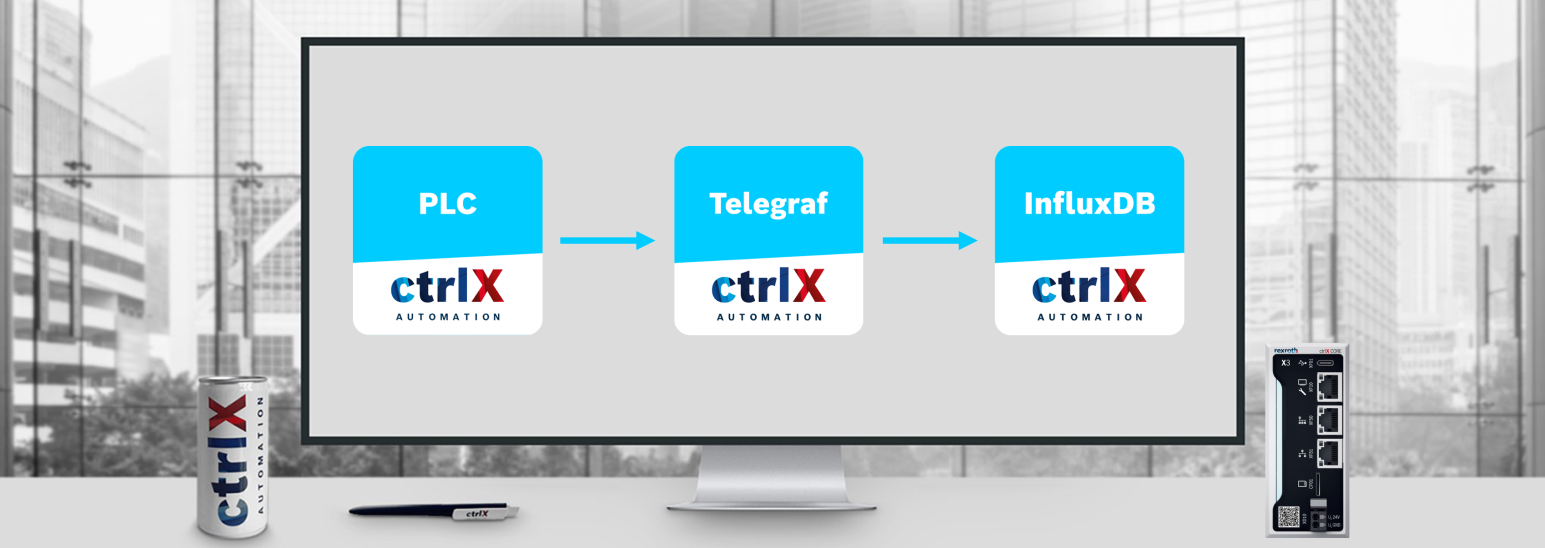
In this tutorial, it will be shown how to visualize and collect PLC values using Telegraf and InfluxDB. On the one side, with the program of the ctrlX PLC Engineering, a PLC program will be written. The PLC program will generate values every 100ms, and these values will firstly be read by Telegraf. Telegraf offers the possibility to collect, process, aggregate information, like metrics, events and logs, and write them to target systems. Telegraf can collect metrics from a wide array of inputs and write them into a wide array of outputs. It is plugin-driven for both collection and output of data so it is easily extendable. In this case, with the ctrlx_datalayer_sse Input Plugin, Telegraf collects the PLC values, and these are later processed by other plugin. With the InfluxDB Output Plugin, Telegraf writes metrics to the InfluxDB App. There, values are collected and they can be manipulated and graphically visualized as desired.
Prerequisites
PLC Program configuration
In this section, it will be shown how to write a program with 10 variables that are updated every 100ms. Additionally, it will be shown how to connect to a ctrlX CORE with the objective to post these values in the Data Layer.
Note: It will be assumed that user knows how to connect with the ctrlX CORE. Otherwise, please check this tutorial.
Step 1: Create a new PLC project
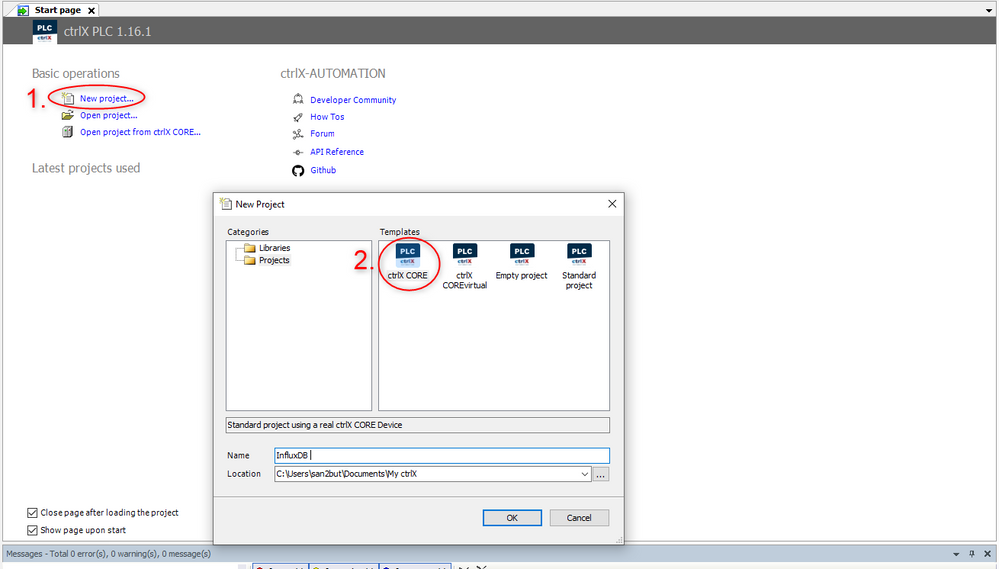
- Open the ctrlX Works PLC Engineering program and create a New project
- Select the "ctrlX CORE" template and choose a project name
Step 2: Communicate with ctrlX CORE to be able to later transfer the PLC program
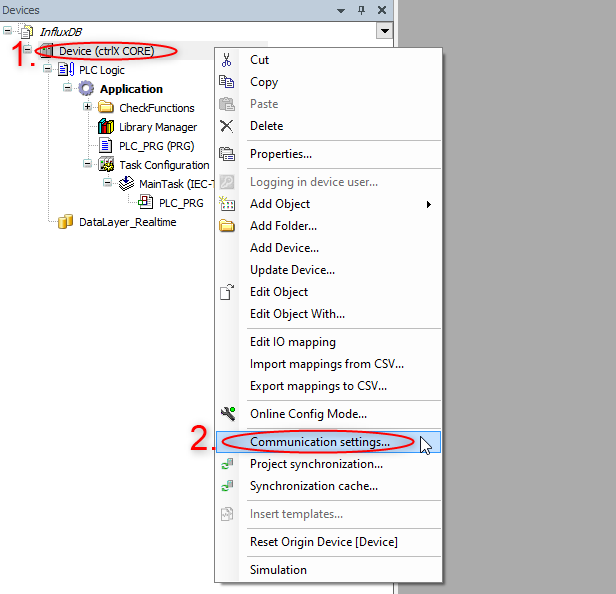
- Right click over the "Device (ctrlX CORE)"
- Select "Communication settings"
- Introduce the ctrlX CORE's IP address, test the connection and close the window
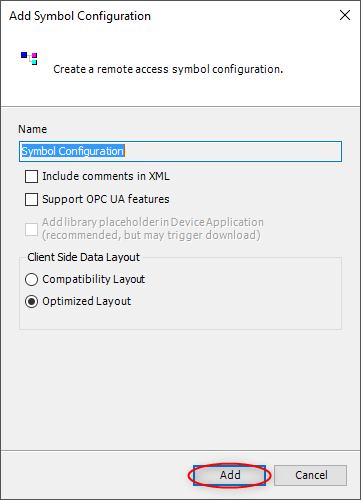
Step 3: Add Symbol configuration
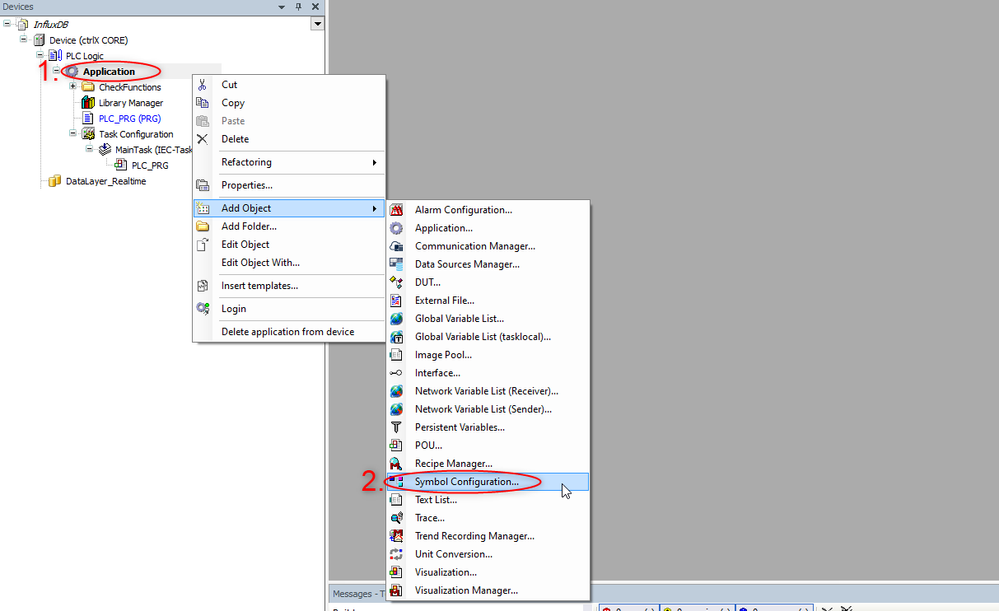
- Right click over "Application"
- Choose "Add object" and select "Symbol Configuration"
- Leave everything as default and press "Add"
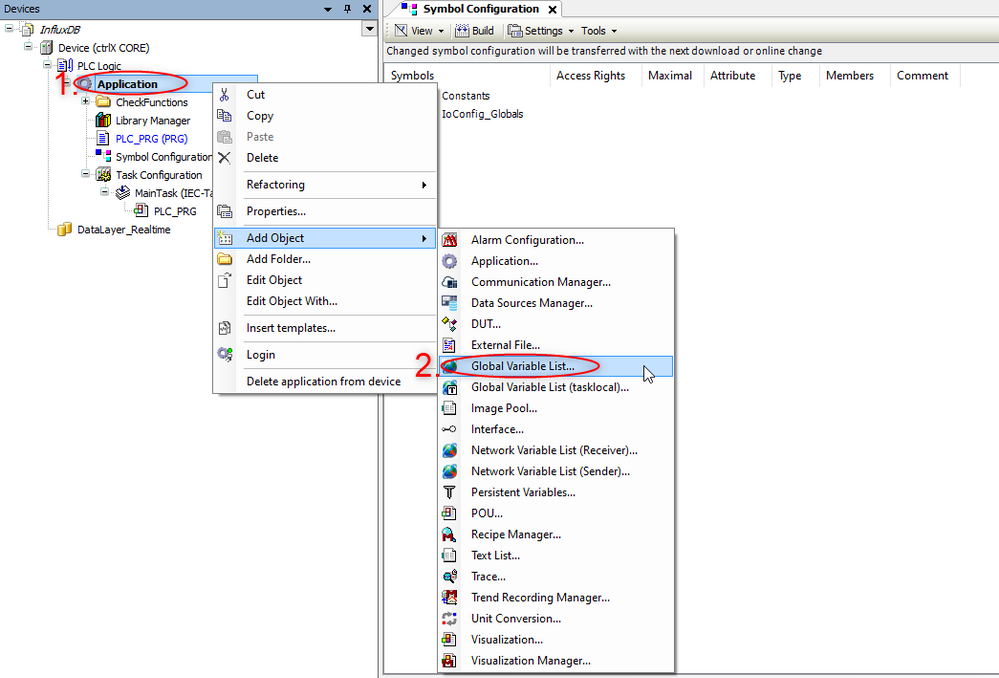
Step 4: Define global variables
- Right click over "Application"
- Choose "Add object" and select "Global Variable List"
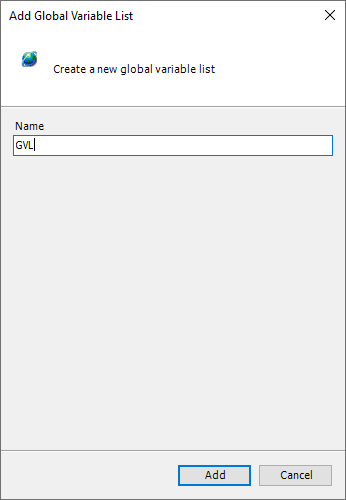
- Choose a name and press "Add"
- To be able to see the variables values in the Data Layer, in the GVL node, write the following line before the global variables definition:
{attribute 'symbol':='read'}
- Define the global variables
In this case, 10 different global variables are defined. Each one will start with a 10 offset difference with the objective to better visualize them in InfluxDB
VAR_GLOBAL
    iCounter_0 : USINT := 0;
    iCounter_1 : USINT := 10;
    iCounter_2 : USINT := 20;
    iCounter_3 : USINT := 30;
    iCounter_4 : USINT := 40;
    iCounter_5 : USINT := 50;
    iCounter_6 : USINT := 60;
    iCounter_7 : USINT := 70;
    iCounter_8 : USINT := 80;
    iCounter_9 : USINT := 90;
END_VAR
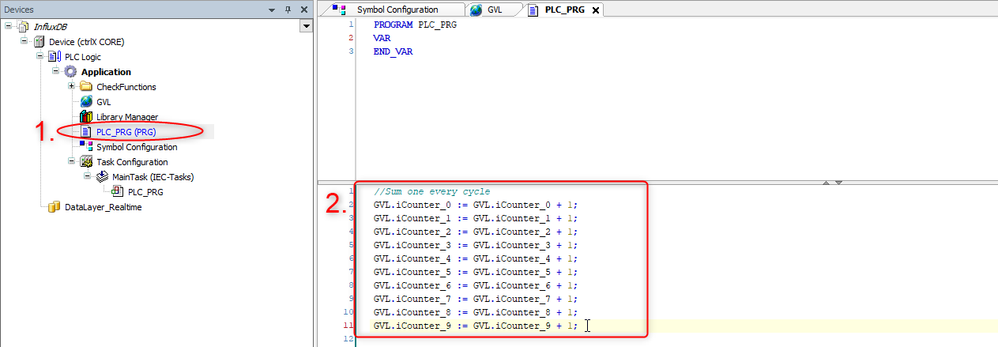
Step 5: Write the PLC program
- Double click over "PLC_PRG (PRG)"
- In the code section, write the PLC program. The idea is to sum one every cycle for each of the variables:
//Sum one every cycle
GVL.iCounter_0 := GVL.iCounter_0 + 1;
GVL.iCounter_1 := GVL.iCounter_1 + 1;
GVL.iCounter_2 := GVL.iCounter_2 + 1;
GVL.iCounter_3 := GVL.iCounter_3 + 1;
GVL.iCounter_4 := GVL.iCounter_4 + 1;
GVL.iCounter_5 := GVL.iCounter_5 + 1;
GVL.iCounter_6 := GVL.iCounter_6 + 1;
GVL.iCounter_7 := GVL.iCounter_7 + 1;
GVL.iCounter_8 := GVL.iCounter_8 + 1;
GVL.iCounter_9 := GVL.iCounter_9 + 1;
Step 6: Define the cycle time
To be able to sum one value every 100ms, it is necessary to define the interval for the PLC program.
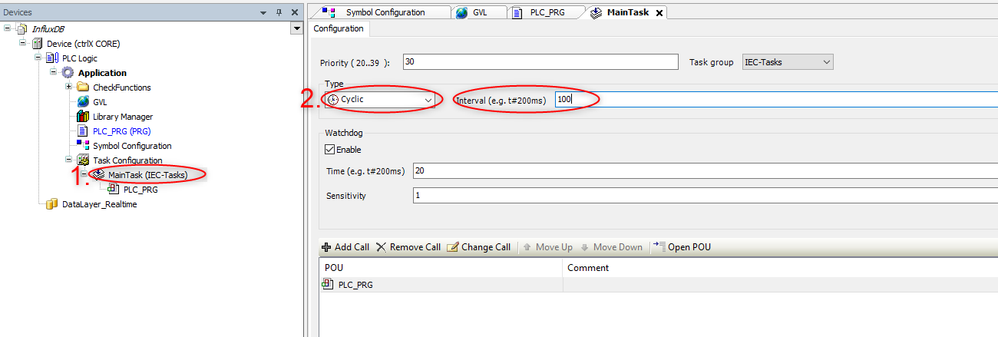
- Double click over "MainTask"
- Make sure the "Cyclic" type is selected and write a 100ms interval. Of course, if the user wants to send data slower or quicker, it is possible to configure it as desired.
Step 7: Transfer data to the ctrlX CORE
- Press the "Login" button and code will automatically generated.
- Accept the message and press "Run"
Step 8: Check the values in the Data Layer
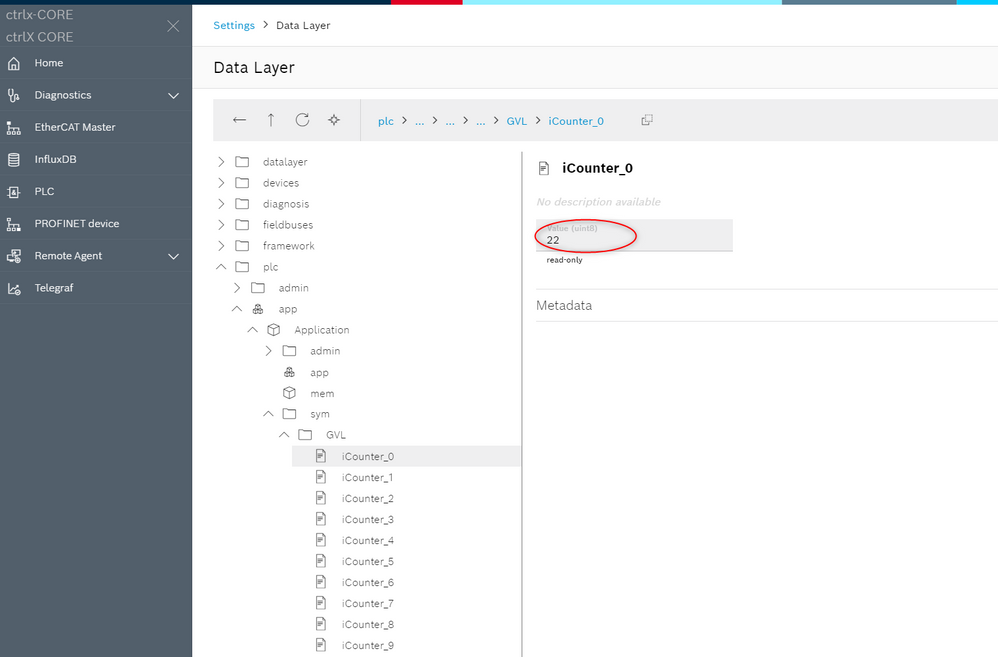
Access the ctrlX CORE web interface, go to "Settings" -> "Data Layer" and check the updated values.
Note: As the values shown in the Data Layer are updated every second, jumps of 10 will be seen.
InfluxDB configuration
In this section, it will be shown how to configure the InfluxDB App. It will be assumed that the user knows how to install the InfluxDB App. Check the Prerequisites section to find the download link and follow this tutorial to install it.
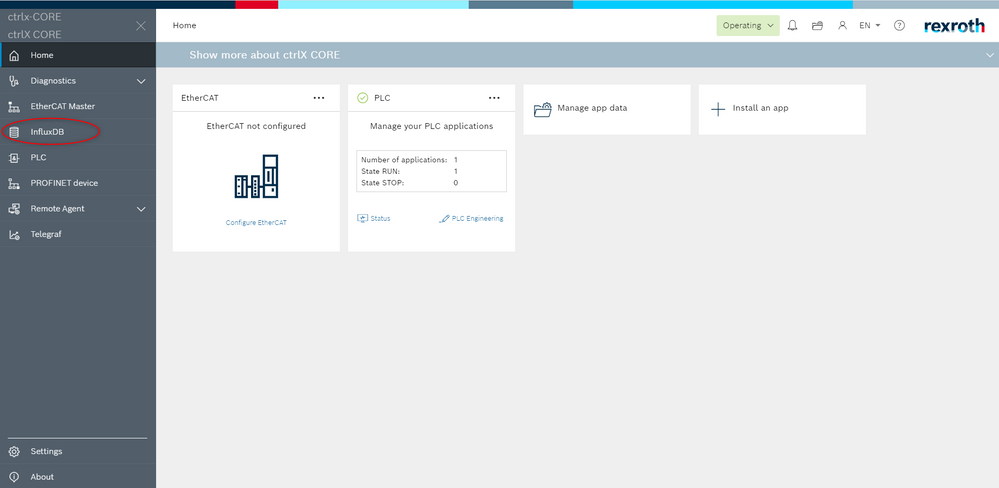
Step 1: Open the InfluxDB App
- A new window will be opened, and there, press "Get Started"
Step 2: Define user settings
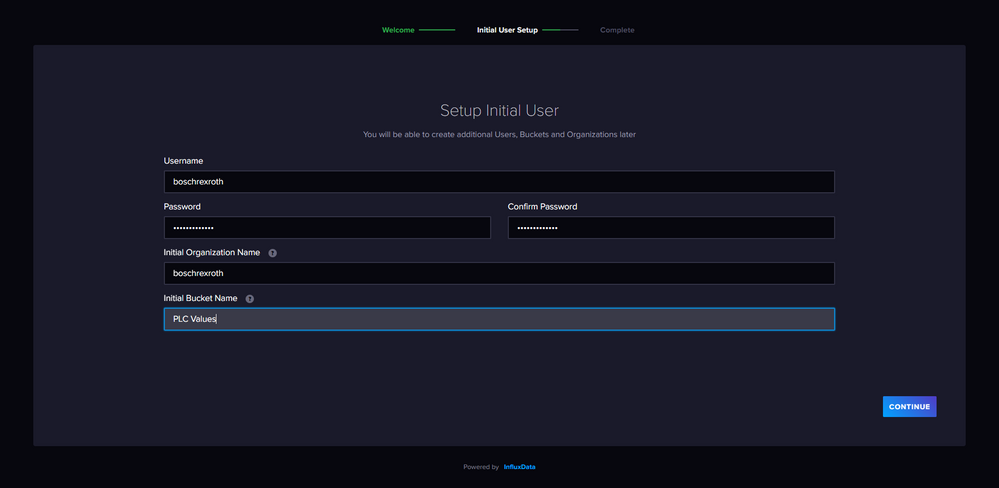
Provide a username, password, organization name, an initial bucket name, and press "Continue".
Note: A bucket is a named location where all our data is stored.
- In the next window, select any of the options.
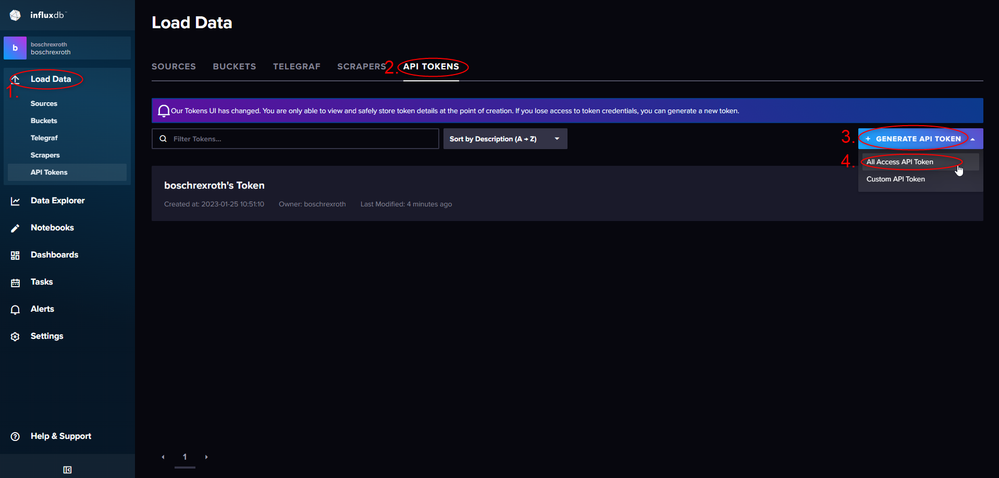
Step 3: Create an API Token
To connect Telegraf with InfluxDB and collect data from Telegraf, it is required to get a token. This token will also be necessary to configure the Output plugin in Telegraf.
- Select "Load Data"
- Press "api tokens"
- Press "Generate api token"
- Select "All Access API Token"
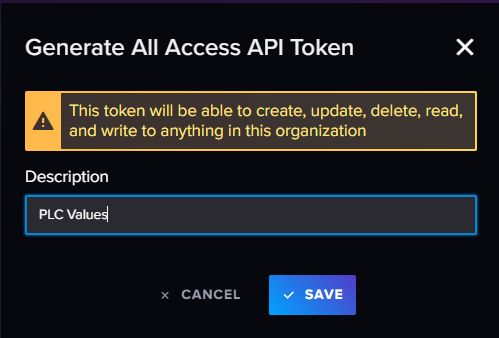
- Choose a name
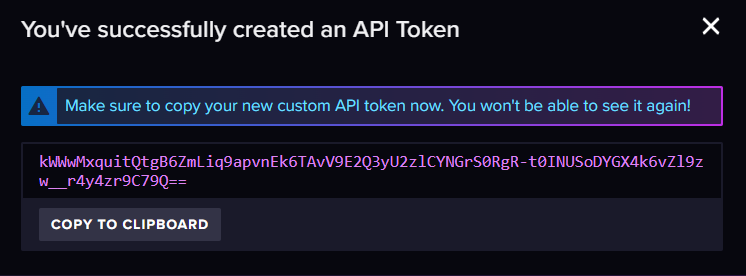
- Copy to clipboard the generated token, and keep it safe to later use it to configure the Telegraf App.
Telegraf configuration
In this section, it will be shown how to configure the Telegraf App. It will be assumed that the user knows how to install the App. Check the Prerequisites section to find the download link and follow this tutorial to install it.
Step 1: Start to configure the Telegraf App
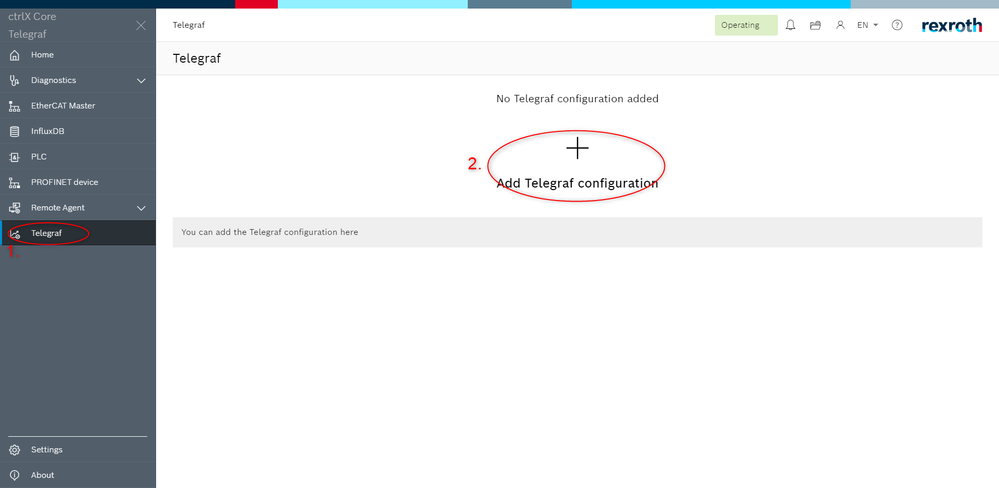
- Press the "Telegraf" node
- Press "Add Telegraf configuration"
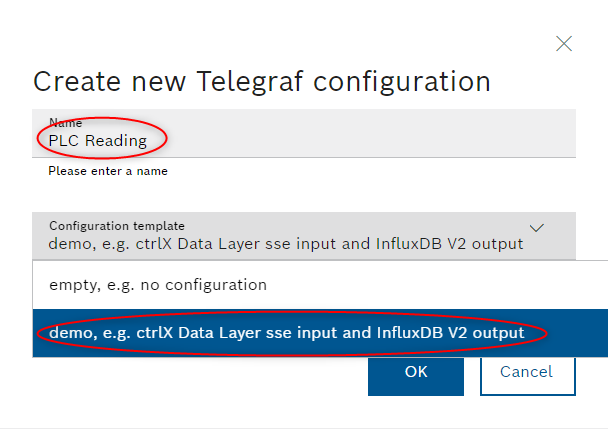
- Choose a configuration name and select a configuration template.
Note: In the case, the user would like to better understand how the used plugins can be configured, it is recommended to select the demo plugin. Otherwise, the configuration template will be provided in this article.
Step 2: Configure Telegraf
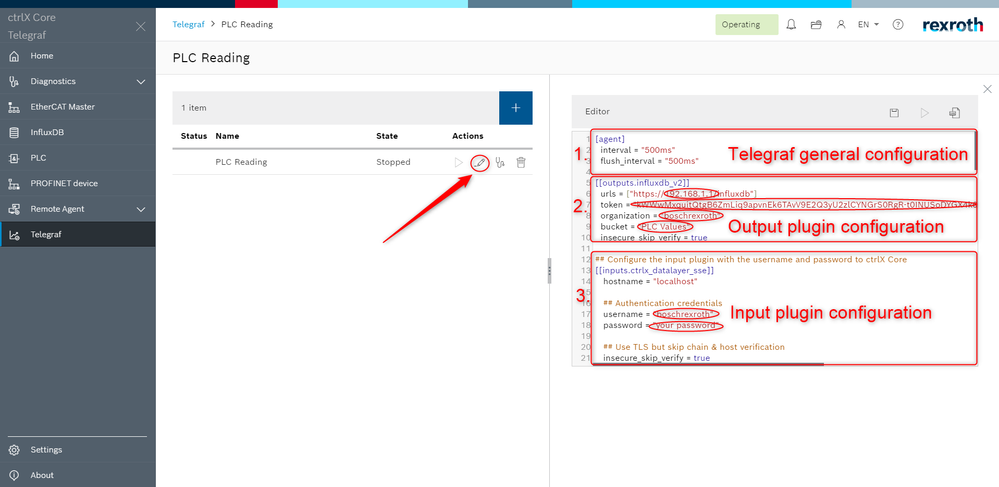
Press the "Edit" button and the Editor will be opened.
- The [agent] section is to define general Telegraf configurations, but it is not required to configure for this tutorial. It is shown that there are more configuration options.
- The output plugin is configured. This plugin sends the processed data in Telegraf, to InfluxDB.
Note: There are many other outputs plugins which can be found here. Make sure to write the ctrlX CORE's IP address, token, organization and bucket. - The input plugin is started to configure. Note: There are also many input plugins which can be found here.
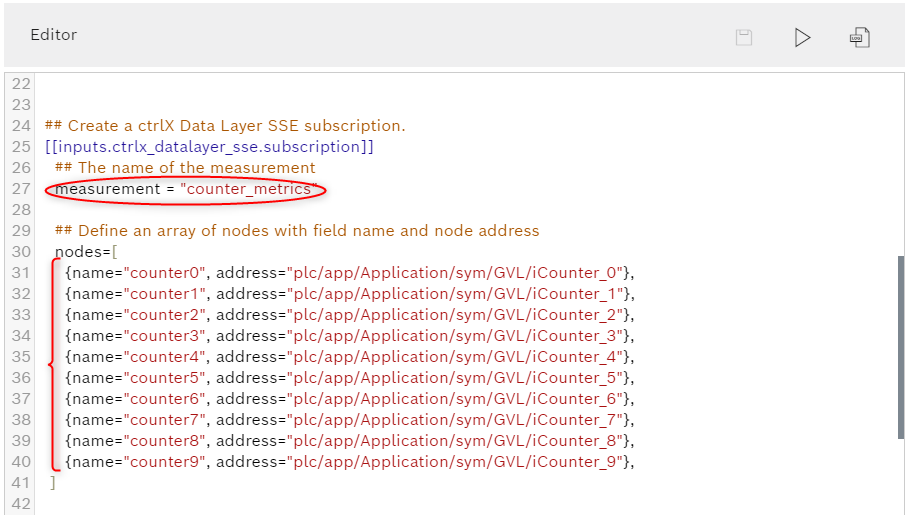
- Configure the ctrlX Data Layer SSE subscription: Define the measurement name. This name will be later seen in the InfluxDB App.
Note: The address is obtained from the Data Layer. The address can be found there opening the plc node -> app -> Application -> sym -> GVL.
Step 3: Define the queue size and the publish and sampling interval
- The queue size defines the number of values that can be stored at the input in the case more values are captured than sent.
- The publish interval defines how fast values are published into Telegraf and read by the input. The higher publish interval values, the lower is the load on the network. However, more values are kept in queue.
- The sampling interval defines the fastest rate at which the node values should be sampled and captured. Higher sampling frequence increases load on ctrlX Data Layer. Note: The sampling frequency can be higher, than the publish interval. Captured samples are put in a queue and sent in publish interval
- In this case, a 1000ms publish interval is chosen. Additionally, a 100ms sampling interval is chosen to be able to correctly read the 100ms PLC values. Finally, a 20 queue size is chosen. As every second, 10 values are written, a 10 queue size should be enough, but to make sure that no value is lost, the size is increased.
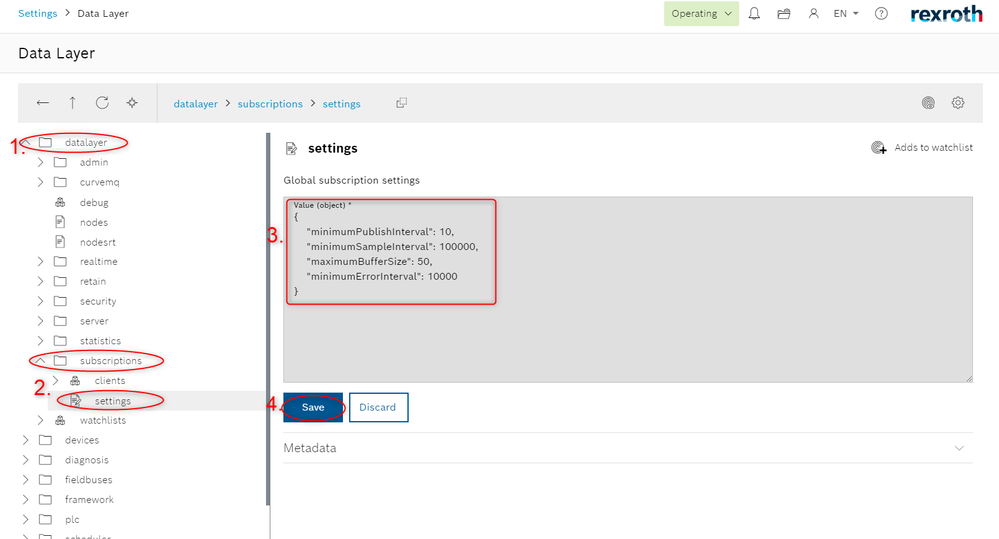
Note: In the case the user wants to have lower sampling intervals than 100ms, lower publish interval values than 50ms, or a larger buffer size, it is necessary to change the global subscription settings in the Data Layer. This configuration can be changed as shown:
- Access the Data Layer in "Settings" -> "Data Layer". Open the "datalayer" tree
- In the "datalayer" tree, open the "subscriptions" node and select "settings"
- Change the desired values
- Press "Save" to keep the new configuration
- The code used for this tutorial is the following:
# Configure general Telegraf settings
[agent]
 interval = "500ms"
 flush_interval = "500ms"

[[outputs.influxdb_v2]]
 urls = ["https://192.168.1.1/influxdb"]
 token = "enter your token"
 organization = "boschrexroth"
 bucket = "PLC Values"
 insecure_skip_verify = true

## Configure the input plugin with the username and password to ctrlX Core
[[inputs.ctrlx_datalayer_sse]]
 hostname = "localhost"

 ## Authentication credentials
 username = "enter your username"
 password = "your password"

 ## Use TLS but skip chain & host verification
 insecure_skip_verify = true


 ## Create a ctrlX Data Layer SSE subscription.
 [[inputs.ctrlx_datalayer_sse.subscription]]
   ## The name of the measurement
   measurement = "counter_metrics"

   ## Define an array of nodes with field name and node address
   nodes=[
     {name="counter0", address="plc/app/Application/sym/GVL/iCounter_0"},
     {name="counter1", address="plc/app/Application/sym/GVL/iCounter_1"},
     {name="counter2", address="plc/app/Application/sym/GVL/iCounter_2"},
     {name="counter3", address="plc/app/Application/sym/GVL/iCounter_3"},
     {name="counter4", address="plc/app/Application/sym/GVL/iCounter_4"},
     {name="counter5", address="plc/app/Application/sym/GVL/iCounter_5"},
     {name="counter6", address="plc/app/Application/sym/GVL/iCounter_6"},
     {name="counter7", address="plc/app/Application/sym/GVL/iCounter_7"},
     {name="counter8", address="plc/app/Application/sym/GVL/iCounter_8"},
     {name="counter9", address="plc/app/Application/sym/GVL/iCounter_9"},
  ]

  ## The interval in which messages shall be sent by the ctrlX Data Layer to this plugin
  ## Higher values reduce load on network by queuing samples on server side and sending as a single TCP packet.
  publish_interval = "1000ms"

  ## The interval that defines the fastest rate at which the node values should be sampled and values captured. (default: 1s)
  sampling_interval = "100ms"

  ## The requested size of the node value queue. (default: 10)
  queue_size = 20
Step 4: Save the configuration and test the app
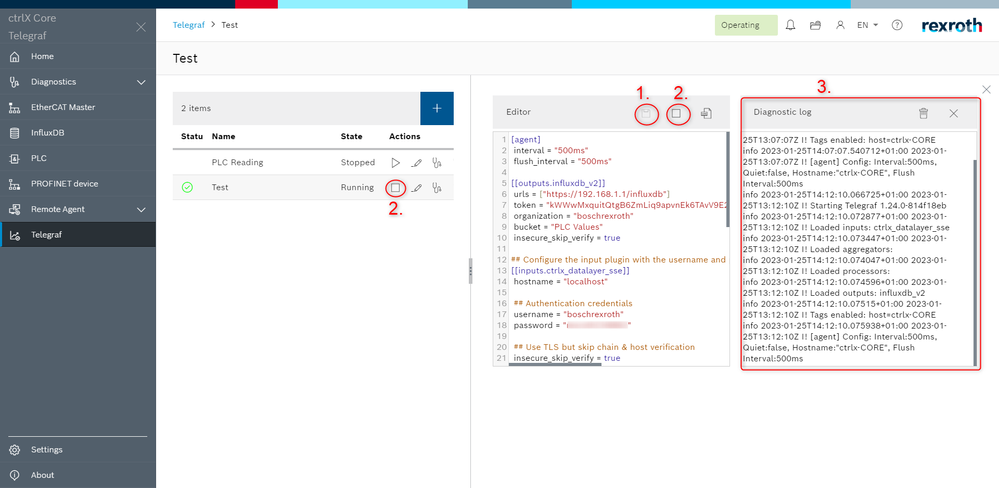
- Press the "Save" button to store all the configuration
- Press the "Run" button
- Check the Diagnostic log to see that everything is working properly
Note: In the case the user wants to check the configuration in the Data Layer, follow the steps:
- Access the Data Layer and open the "datalayer" tree
- Open the "subscriptions" tree and open the "Clients" node
- Select the second client and check the different subscription until finding one similar to the one shown in the image. Once selected, it is possible to check all the Telegraf configuration
Testing
Once everything has been configured, return back to the InfluxDB App.
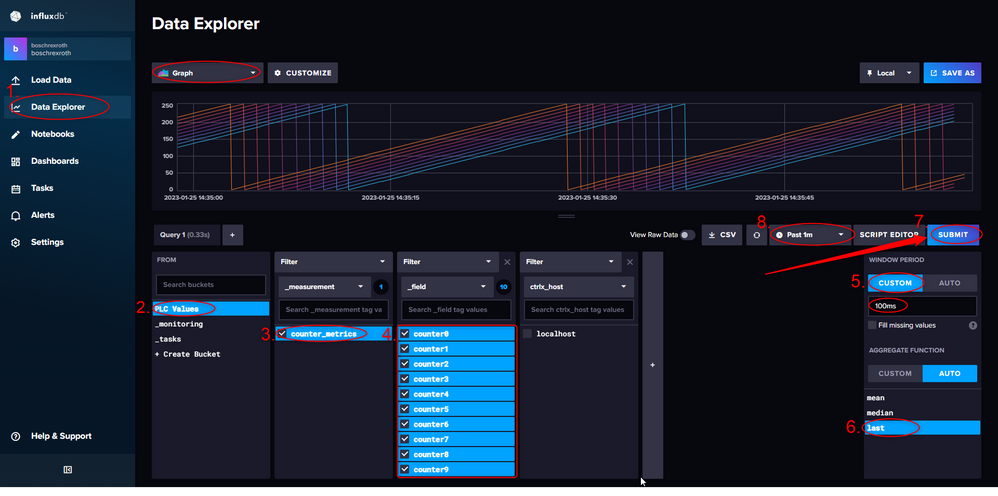
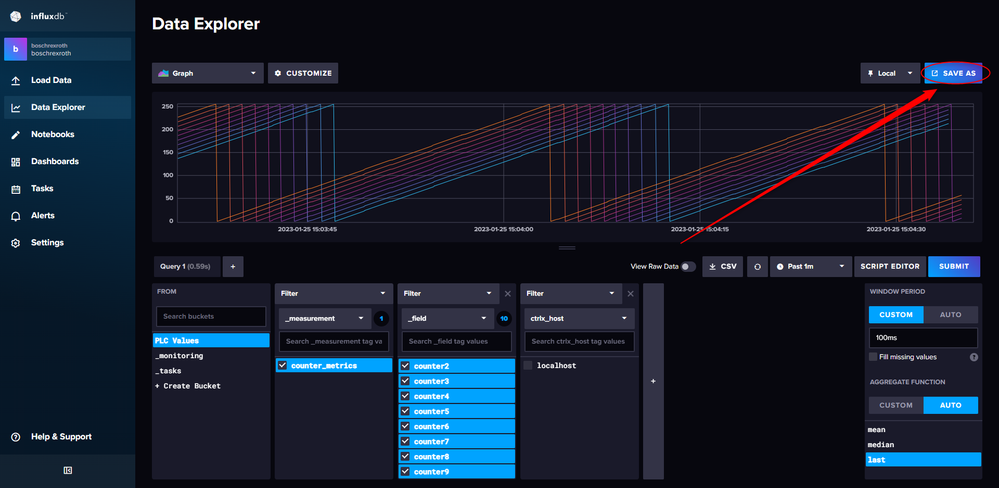
- In the InfluxDB App, go to "Data Explorer". There it is possible to read all the data collected by influxDB
- Select the "PLC Values" bucket as there all the data sent by Telegraf, is stored
- As it is possible to define multiple measurements, the "counter_metrics" measurement has to be chosen
- All the counters are selected
- In the window period tab, "Custom" is pressed with the objective to establish a 100ms window period
- To have the raw values, and not mean or median values if values are missing, the "last" option is selected
- Press the "Submit" button and the graph will be created
- If the user wants to use values from more than 1 minute, it is possible to change this configuration as shown
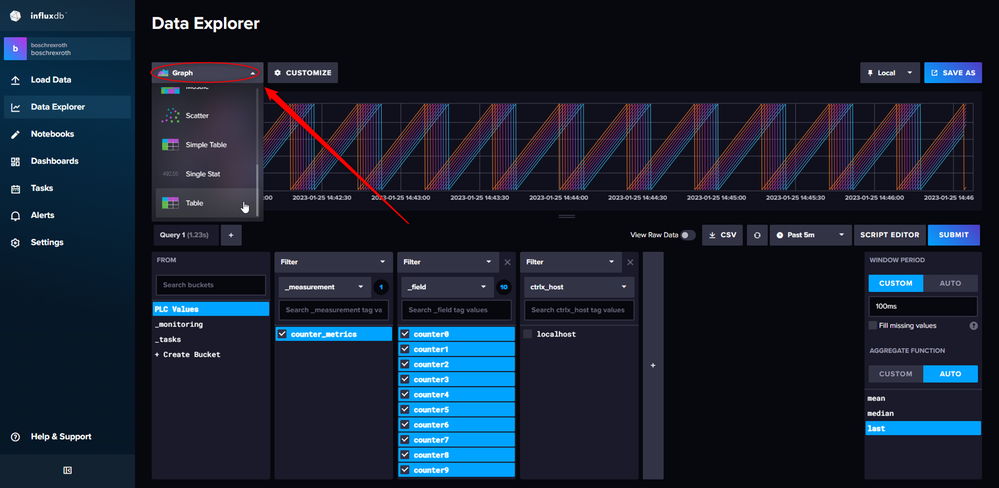
- If the user wants to visualize data differently, it is possible to change to tables, histograms, mosaics, heatmaps, etc.
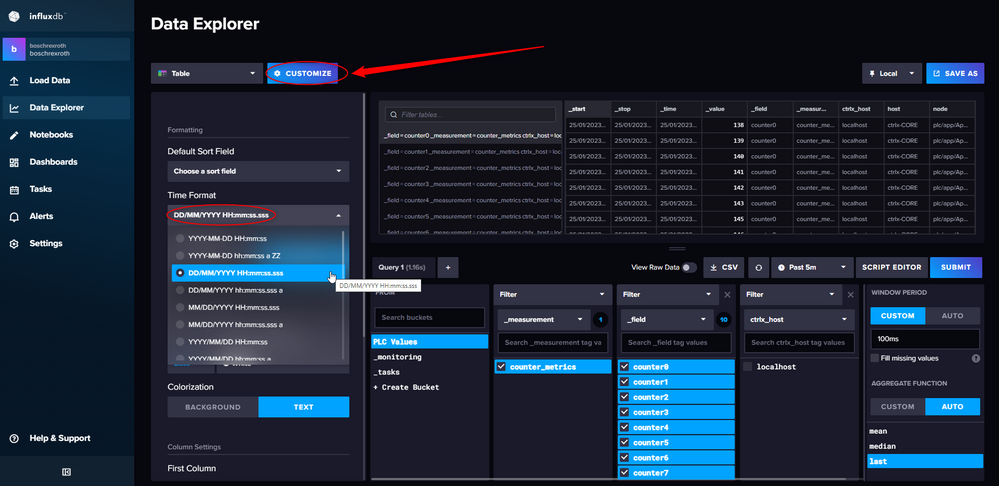
- Additionally, it is also possible to customize even more the visualization pressing the "Customize" button. In this case, as we are receiving values every 100ms, it is interesting to change the time format.
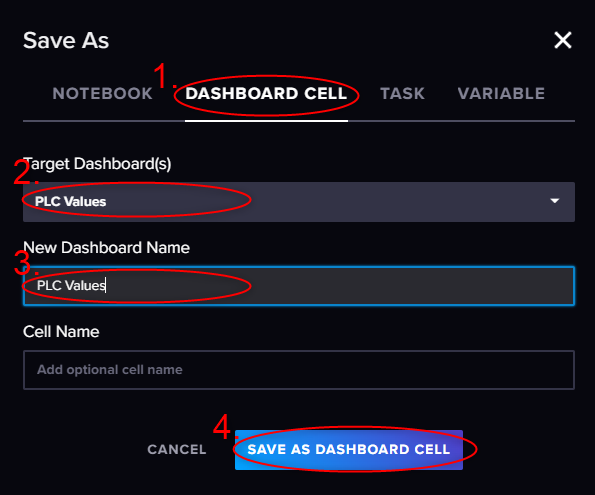
- To create a dashboard with the performed configuration, press the "Save as" button.
- Select "Dashboard Cell"
- Select "Create a New Dashboard" in the Target Dashboard
- Write a desired name
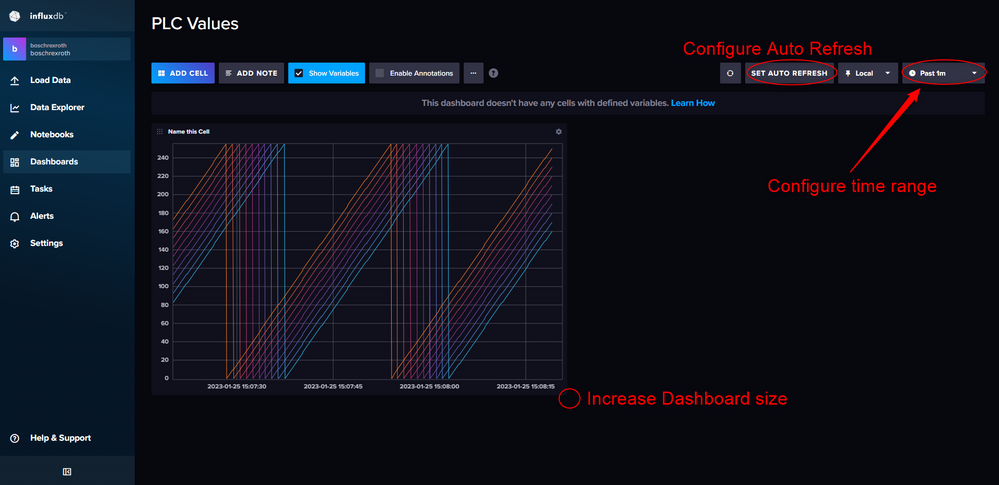
- Save the configuration and a Dashboard will be created
- To visualize the created dashboard, access the "Dashboard" section, and select the dashboard name.
You must be a registered user to add a comment. If you've already registered, sign in. Otherwise, register and sign in.


