- Subscribe to RSS Feed
- Mark as New
- Mark as Read
- Bookmark
- Subscribe
- Printer Friendly Page
- Report Inappropriate Content
Content
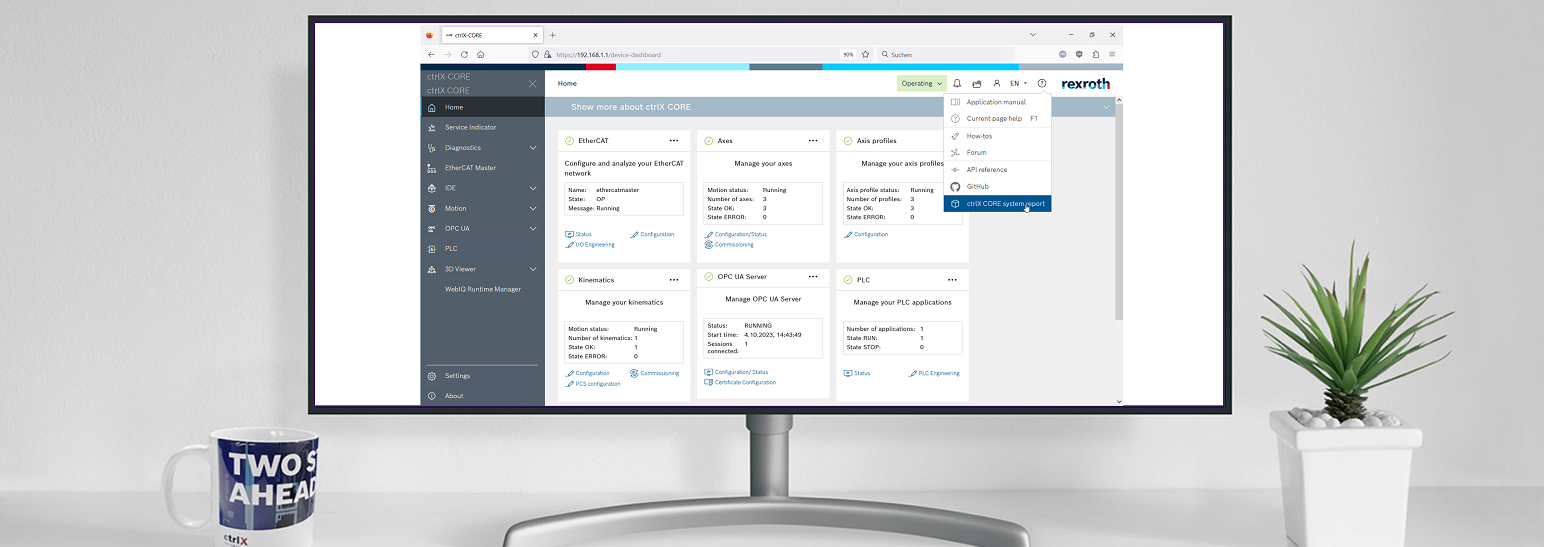
This article shows how to generate a system report in the control ctrlX CORE and the software tool ctrlX WORKS and how to switch on additional traces in the ctrlX CORE via the data layer.
Requirements
Connection to a ctrlX CORE hardware, ctrlX OS or ctrlX WORKS installed on a PC
Explanation
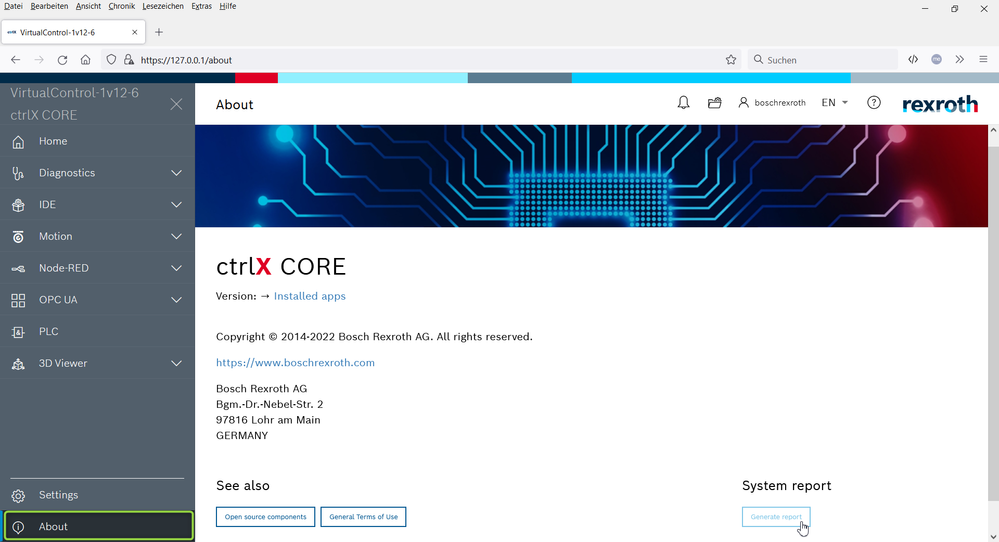
ctrlX CORE 1.12
Via the about area in ctrlX CORE web UI:
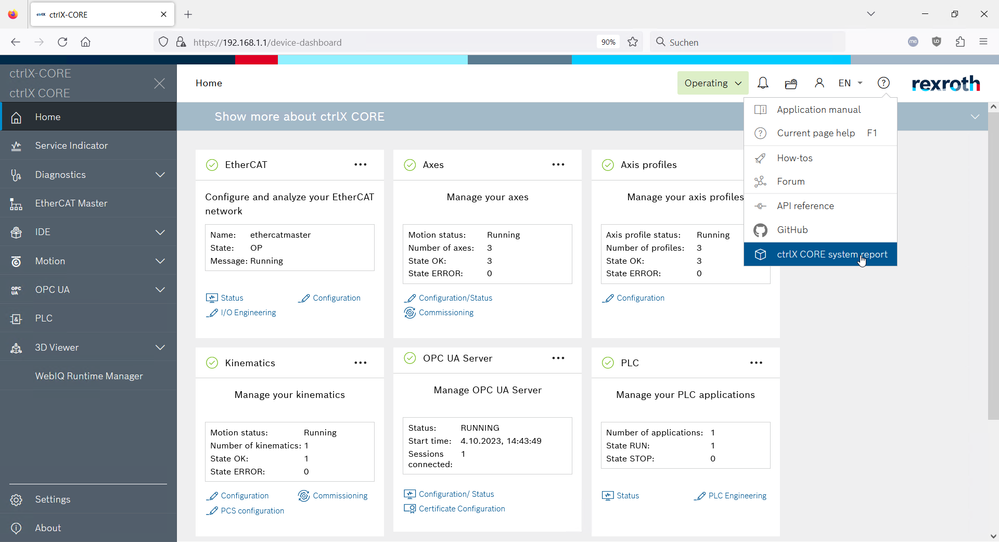
ctrlX CORE ≥ 1.20
Via "?" symbol on the right top in your crlX CORE web UI:
Additional traces on ctrlX CORE
Installed apps can have internal traces for deeper analysis by the developers. These can be published into the diagnostic logbook of the ctrlX CORE.
If asked to, activating is done via the data layer by writing three times true (or 1) for switching on messages, warnings and errors. Beware that activating traces can add a lot of additional messages and postpone other ones, so the standard setting should be deactivated.
e.g. to the paths for:
- general motion purposes "trace/rexroth-automationcore/units/motion/core"
- switching up problems of the axisprofile "trace/rexroth-automationcore/units/comm/axisprofile"
- switching state problems of the EtherCat master "trace/rexroth-automationcore/units/comm/ethercat"
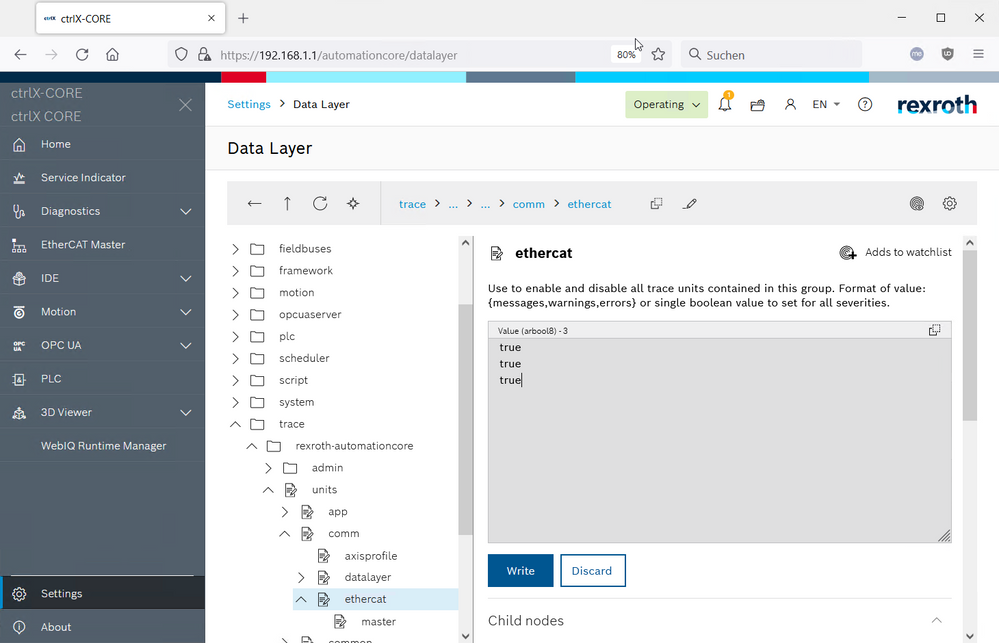
If this settings needs to be persistent an save (via create) needs to be executed via the ".../admin/cfg/save" node sending payload {"configurationPath": "", "id": "", "phase": "save"}:
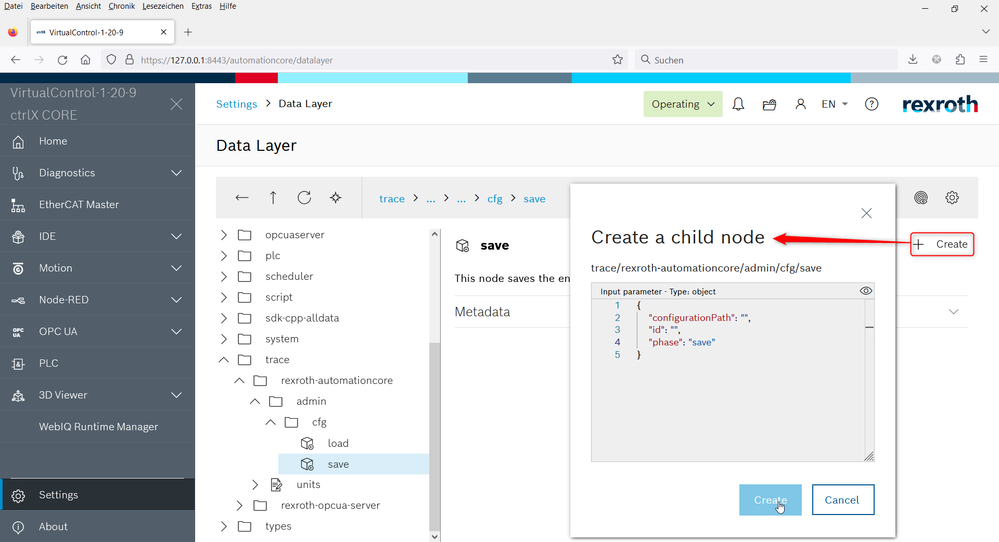
Note: By setting values in a top node (e.g. units/comm) all subsequent nodes (e.g. units/comm/ethercat) are also set.
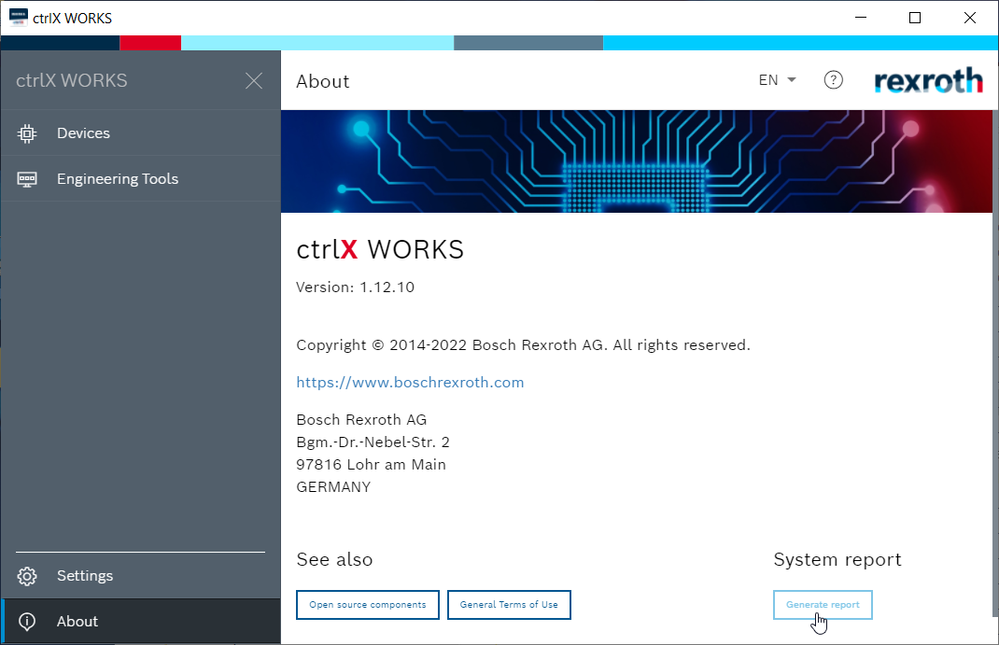
ctrlX WORKS 1.12
Via the about area in ctrlX WORKS UI:
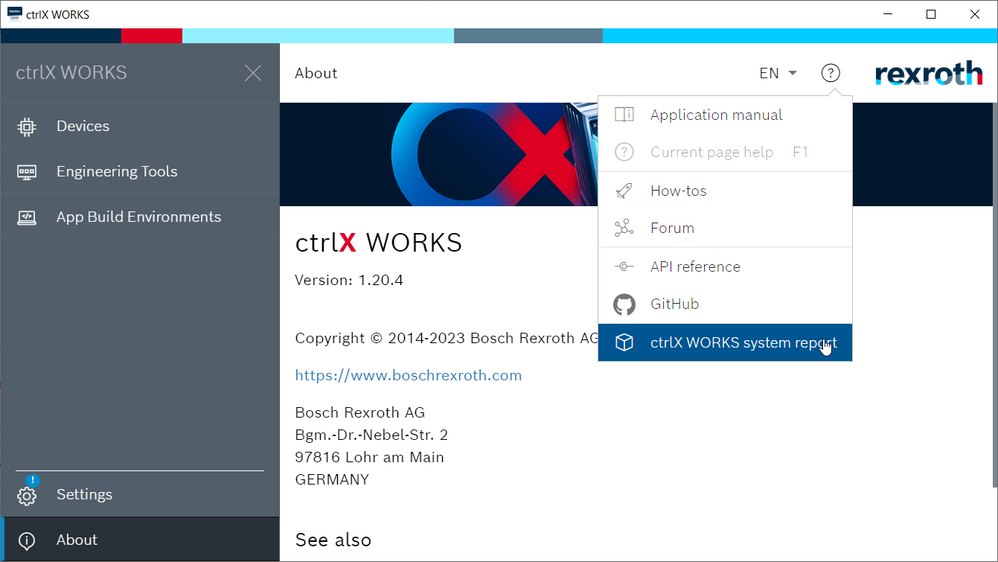
ctrlX WORKS ≥ 1.20
Via "?" symbol on the right top in your crlX WORKS UI:
Related information

You must be a registered user to add a comment. If you've already registered, sign in. Otherwise, register and sign in.


