- Subscribe to RSS Feed
- Mark as New
- Mark as Read
- Bookmark
- Subscribe
- Printer Friendly Page
- Report Inappropriate Content
Check of regulation loops using frequency response analysis with ctrlX DRIVE
In the following we show to you how you may check the regulation loops using the frequency response analysis with ctrlX DRIVE via the ctrlX DRIVE Engineering tool.
For a more detailed step by step procedure refer to the document that is attached to this article.
1. Check proper settings of filters
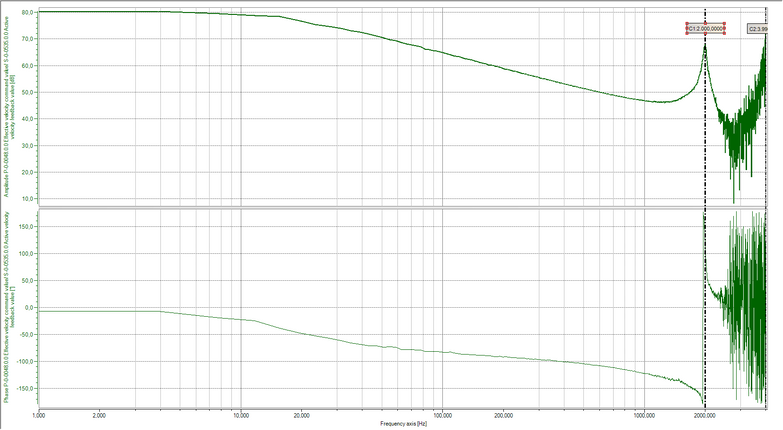
Use analysis of "Speed-controlled system”.
Check result if one or more dominant resonance frequencies can be seen. In here at 2000 Hz a dominant resonance frequency is present.
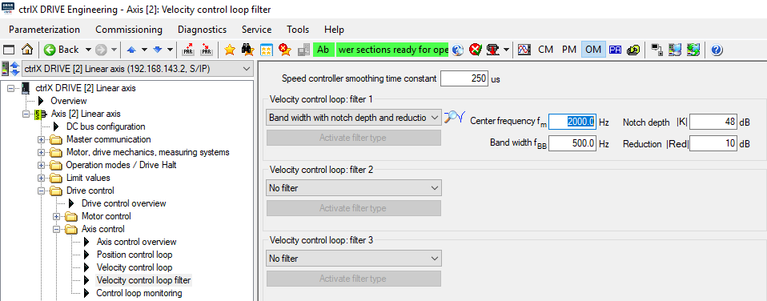
Check if dominant resonance frequency or frequencies are properly suppressed.
2. Check proper settings of speed loop
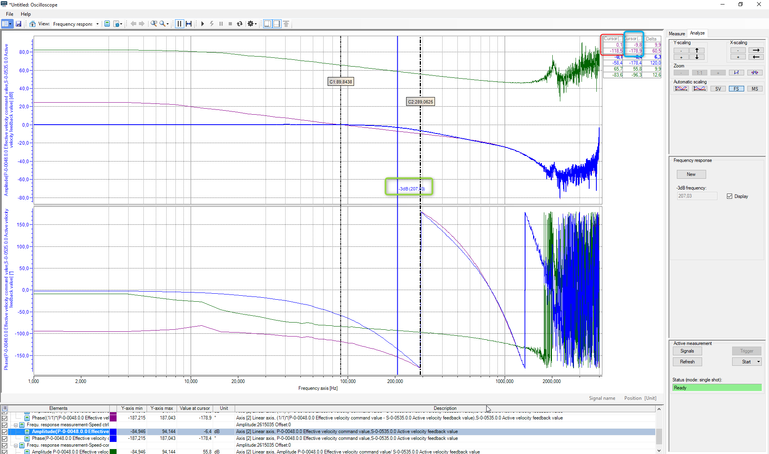
Use “Analysis of speed control loop”.
Show - 3 dB line. Move cursor 1 to position where purple line meets “0” line in amplitude. Move cursor 2 to position where purple line meets “-180” line in phase.
The green box shows the bandwidth of the closed speed loop and gives an indication of the behavior of the speed loop up to which frequency being able to regulate properly to command, disturbance and load changes.
The red box shows the stability of the regulation loop settings. This so called phase margin is calculated by
180° + (phase value shown at cursor 1) = (in here) 180° + (-118,5°) = 61,5°
For good behavior this value should be in between
- 40° to 70° for good command response behavior
- 20° to 50° for good load response behavior
- 40° to 60° for well balanced loop settings
The blue box shows the stability of the regulation loop settings. This so called amplitude margin is calculated by
- (amplitude value shown at cursor 2) = (in here) - (- 9,8 dB) = 9,8 dB
For good behavior this value should be
- at minimum 5 dB
- usually at least 10 dB for well balanced loop settings
After the frequency, marked for amplitude margin, the blue line should not exceed the -10 dB line at higher frequencies again except on the limits of the diagram at 4000 Hz.
So the settings here are quite well and close to the optimum.
3. Check settings of position loop
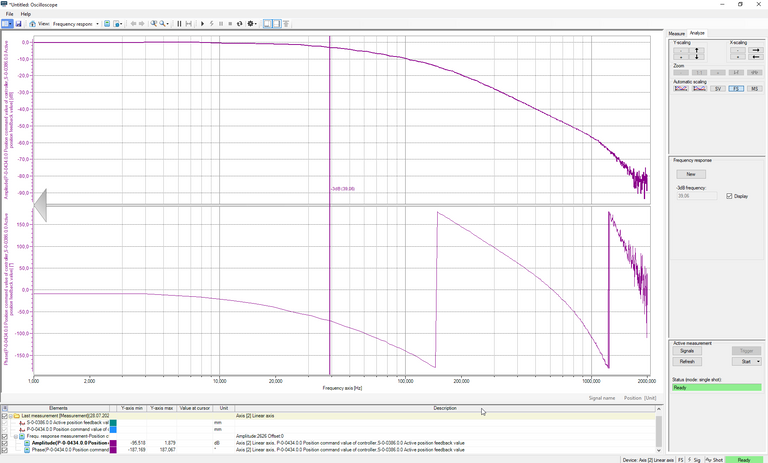
Use “Analysis of position control loop” and show - 3 dB line.
The – 3dB frequency line shows the bandwidth of the position loop and gives an indication of the behavior of the position loop up to which frequency being able to regulate properly to command, disturbance and load changes.
4. Check settings of current loop
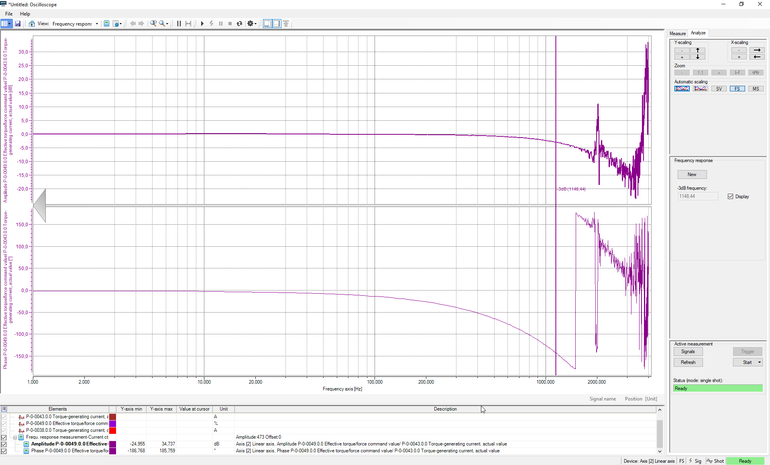
Usually only for kit motors and 3rd party motors the current loop settings need to be checked. In order to do so select the "Current ctrl loop” as type of frequency response measurement and execute the mesurement.
The – 3dB frequency line shows the bandwidth of the current loop and gives an indication of the behavior of the current loop up to which frequency being able to regulate properly. Usually this figure should be higher than 1000 Hz. Otherwise, if this is not the case, the current loop settings should be adjusted.


