FORUM CTRLX AUTOMATION
ctrlX World Partner Apps for ctrlX AUTOMATION
- ctrlX AUTOMATION Community
- ctrlX World Partner Apps for ctrlX AUTOMATION
- Smart HMI - WebIQ Designer and Server
- Re: IO Handler Browser Issue
IO Handler Browser Issue
- Subscribe to RSS Feed
- Mark Topic as New
- Mark Topic as Read
- Float this Topic for Current User
- Bookmark
- Subscribe
- Mute
- Printer Friendly Page
IO Handler Browser Issue
- Mark as New
- Bookmark
- Subscribe
- Mute
- Subscribe to RSS Feed
- Permalink
- Report Inappropriate Content
10-27-2023 06:34 PM - edited 10-27-2023 06:55 PM
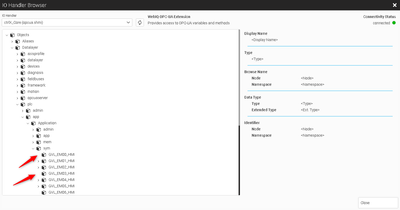
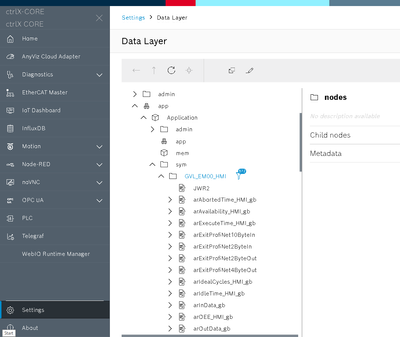
I am seeing some inconsistent behavior when trying to add variables to via the IO Handler Browser. Several of the nodes have child nodes that I would like to access but don't show up in the browser. In the screenshots below I show that the node "Objects/Datalayer/plc/app/Application/sym/GVL_EM00_HMI" has child nodes that show in the data layer but not in the WebIQ Designer IO Handler Browser. Sometimes using the "Reload Browser" button helps and other times it actually shows fewer nodes than previously.
WebIQ Server App Version 2.14.3
WebIQ Designer Version 2.14.0
- Mark as New
- Bookmark
- Subscribe
- Mute
- Subscribe to RSS Feed
- Permalink
- Report Inappropriate Content
10-27-2023 09:58 PM
Hi Brian,
What version of the OPC UA Server application are you using on the CORE?
Do you have any issue browsing the tags with another client like UA Expert?
Are either of these parameters set differently than the defaults in the WebIQ Designer OPC UA Server configuration?
- Mark as New
- Bookmark
- Subscribe
- Mute
- Subscribe to RSS Feed
- Permalink
- Report Inappropriate Content
10-30-2023 08:01 AM
Can you please set the log settings of WebIQ Server to trace, reproduce the issue and provide the log?
Maybe the OPC-UA server might be overwhelmed by the number of queries to generate the tree view?
- Mark as New
- Bookmark
- Subscribe
- Mute
- Subscribe to RSS Feed
- Permalink
- Report Inappropriate Content
10-30-2023 04:07 PM
Hello @webiq-sk,
I've attached the requested log.
It's possible that the OPC-UA server is being overwhelmed, however I've checked with a different OPC-UA client(UaExpert) and didn't have any issues generating the tree and seeing all of the nodes.
- Mark as New
- Bookmark
- Subscribe
- Mute
- Subscribe to RSS Feed
- Permalink
- Report Inappropriate Content
10-30-2023 04:09 PM
@bkautzman You sent the designer.log, but I requested the connect.log - can you please provide the connect.log for analysis?
- Mark as New
- Bookmark
- Subscribe
- Mute
- Subscribe to RSS Feed
- Permalink
- Report Inappropriate Content
10-30-2023 04:53 PM
@webiq-sk Apologies, I've attached the correct log. However, it doesn't appear to have changed at all after I recreated the issue. My 'Log File Severity' and 'Console Out Severity' are set to 'Trace'.
- Mark as New
- Bookmark
- Subscribe
- Mute
- Subscribe to RSS Feed
- Permalink
- Report Inappropriate Content
10-30-2023 04:54 PM
Hello Sam,
I'm using version 1.20.3 of the OPC UA Server app.
I am able to see all of the tags without issue on UaExpert.
My "Max items per command' is set to 0 and my 'Service Call Timeout' is set to 10000. I believe both of those are default values.
- Mark as New
- Bookmark
- Subscribe
- Mute
- Subscribe to RSS Feed
- Permalink
- Report Inappropriate Content
10-31-2023 08:16 AM
As you did not specify how and where the error occurs exactly:
If you have WebIQ Designer running without being connected to WebIQ on ctrlX please provide connect.log from your local system WebIQ Designer is running on.
If you are connected directly to your ctrlX with WebIQ Designer please open http://{ctrlX IP}:10123/, login, click on "Settings", verify that the log settings have been set to "trace", reproduce the error and download the log then from there.
Please always ZIP log files as this saves up to 99%.
- Mark as New
- Bookmark
- Subscribe
- Mute
- Subscribe to RSS Feed
- Permalink
- Report Inappropriate Content
10-31-2023 08:18 AM
I can actually confirm that you provided the wrong log file as it states "Copyright Smart HMI GmbH 2013-2023 WebIQ Server v2.14.0 release/2.14.0/3ddb60cd (Win32 x86_64 Release)" - ctrlX is not a Windows system - you provided the local server log file instead.
Please provide the WebIQ Server log file from your ctrlX as outlined before.
- Mark as New
- Bookmark
- Subscribe
- Mute
- Subscribe to RSS Feed
- Permalink
- Report Inappropriate Content
11-01-2023 08:19 PM
- Mark as New
- Bookmark
- Subscribe
- Mute
- Subscribe to RSS Feed
- Permalink
- Report Inappropriate Content
11-02-2023 08:20 AM - edited 11-02-2023 08:20 AM
As you see there are a lot of timeouts which means that WebIQ Server did not receive a reply from the OPC-UA Server:
[2023-11-01 19:16:24.553834] [ debug | ctrlX_Core] read() failed
[2023-11-01 19:16:24.553834] [ debug | ctrlX_Core] what(): BadTimeout
This can be a network issue, the OPC-UA server is not running or it is overloaded at that time so much that it doesn't report a corresponding OPC-UA message indicating overloading.
It would be interesting to know what happens if you connect to the OPC-UA server using UA Expert when the issue is occurring in the HMI.
- Mark as New
- Bookmark
- Subscribe
- Mute
- Subscribe to RSS Feed
- Permalink
- Report Inappropriate Content
11-02-2023 03:38 PM
As I mentioned in my reply to Sgilk, I am able to connect via UA Expert with no issues and all of the nodes are displayed.
- Mark as New
- Bookmark
- Subscribe
- Mute
- Subscribe to RSS Feed
- Permalink
- Report Inappropriate Content
11-02-2023 03:44 PM
From what you wrote I only deducted that you can connect with UA Expert in general, not whether you can also connect at the exact time the issue occurs. Can you please confirm that?
- Mark as New
- Bookmark
- Subscribe
- Mute
- Subscribe to RSS Feed
- Permalink
- Report Inappropriate Content
11-02-2023 06:00 PM
I'm not sure I can test at the "exact" time, but yes I can connect via UaExpert within a few seconds of browsing via WebIQ Designer. I will see the issue in Designer but be able to view all of the nodes in UaExpert.
- Mark as New
- Bookmark
- Subscribe
- Mute
- Subscribe to RSS Feed
- Permalink
- Report Inappropriate Content
a week ago


