FORUM CTRLX AUTOMATION
ctrlX World Partner Apps for ctrlX AUTOMATION
Dear Community User! We are updating our platform to a new
system.
Read more: Important
information on the platform change.
- ctrlX AUTOMATION Community
- Forum ctrlX AUTOMATION
- ctrlX CORE
- Re: x3 Core unresponsive with red flashing status light.
x3 Core unresponsive with red flashing status light.
- Subscribe to RSS Feed
- Mark Topic as New
- Mark Topic as Read
- Float this Topic for Current User
- Bookmark
- Subscribe
- Mute
- Printer Friendly Page
- Mark as New
- Bookmark
- Subscribe
- Mute
- Subscribe to RSS Feed
- Permalink
- Report Inappropriate Content
06-13-2023 06:18 PM
I have noticed this twice now, the last two week, When I come back into work after the weekend the unit is showing a red flashing light and unreachable through a web browser.
The WebIQ application is still running on the HMI and can be restarted; but I am not able to connect the VPN (from an on screen button).
A reboot resolves the error, the unit is reachable through a browser and the VPN screen control works again.
core is running 1.20
Solved! Go to Solution.
- Mark as New
- Bookmark
- Subscribe
- Mute
- Subscribe to RSS Feed
- Permalink
- Report Inappropriate Content
06-14-2023 10:33 AM
Could you a bit more specify what you mean by "connect the VPN (from an on screen button)"? Is the ctrlX CORE web UI still reachable? Is the page for the installed apps still reachable?
- Mark as New
- Bookmark
- Subscribe
- Mute
- Subscribe to RSS Feed
- Permalink
- Report Inappropriate Content
06-14-2023 02:27 PM
Core UI is not reachable, so i cannot get to the installed apps or any other part of the Core.
I have a button on the HMI to connect and disconnect the VPN, I also have a status coming back to show me the state of the VPN connection. The HMI Function of the button stills works in this condition, but the VPN status never changes and the VPN never connects; this indicates to me that nothing at the datalayer is responding.
- Mark as New
- Bookmark
- Subscribe
- Mute
- Subscribe to RSS Feed
- Permalink
- Report Inappropriate Content
06-14-2023 02:46 PM
Could you
- add a system report, so we can see which apps in which version are installed?
- check if your RAM or internal flash storage utilisation is increasing over time?
- Mark as New
- Bookmark
- Subscribe
- Mute
- Subscribe to RSS Feed
- Permalink
- Report Inappropriate Content
06-14-2023 04:53 PM
where do i pull a system report from? under diagnostics, looking at the logbook; I wasn't ware that I had to set logs to persistant, I don;t have any entries older than the 13th. The lockup occured sometime between the 9th and 12th. Not sure where to see utilization either,
My memory is running high, I have .04GB free if 1.95GB but that is a with a buffer of 1.21GB so I assume that is normalish?
CPU is is a bit uneven Cores 0 and 1 stay around 7.5% While Core 2 is around 8.5%, and Core 3 is down around 3.8%. but I don't really know how those are utilized.
Looking at my apps, everything is current to 1.20, except the IDE at 1.18.29 which was included with the Core 1.20 update. OPC UA Client mathes the Collaboration room at 1.12.4, and DeviceBridge was updated a few weeks ago to 3.2.8.
- Mark as New
- Bookmark
- Subscribe
- Mute
- Subscribe to RSS Feed
- Permalink
- Report Inappropriate Content
06-15-2023 07:27 AM
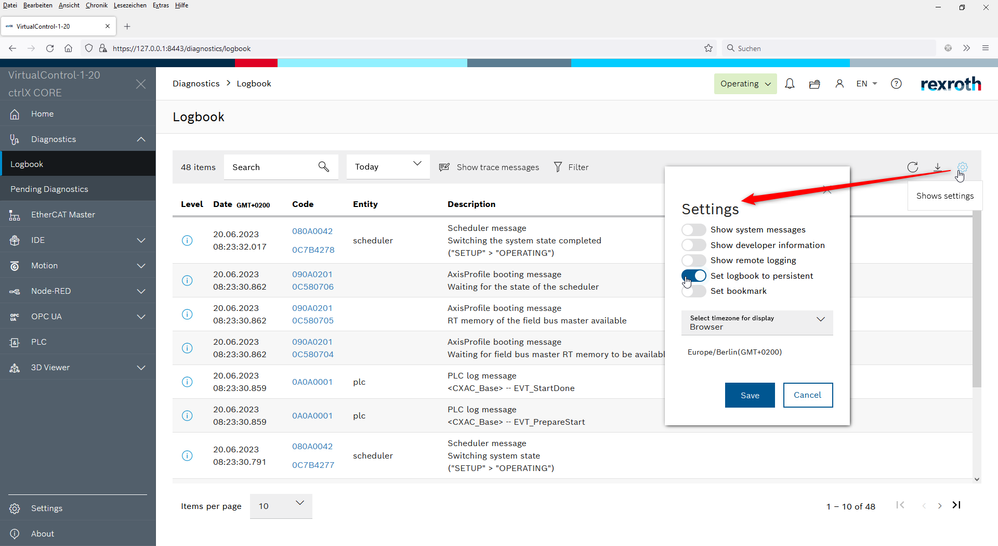
To reduce storage cycles of the internal flash memory the standard setting for the logbook is to be not persistent. We recommend to use remote logging for storing long time logbook data. See online documentation.
Creating a system report from version 1.18 on: click on the question mark symbol on right top of your ctrlX CORE web UI (See in online documentation). (For older system app version see documentation here).
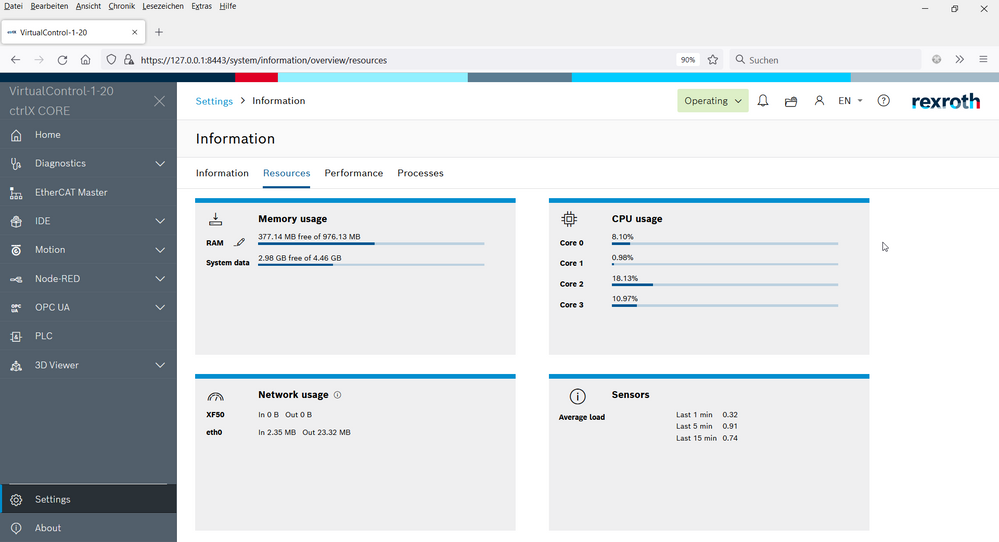
On the page "Settings -> Information -> Resources" you will see an overview of different utilization like memory, CPU, network...

Having a high buffer is fine as it will be reduced dynamically by the system.
The 1.20 app package located beside of the system image and ctrlX WORKS installation is also including a later version of the OPC UA client app. Please use the latest pre release version for further tests. See list of all apps included:
System_Apps | 3D Viewer 3DV-V-0120.1 | Container Engine DOE-V-0118.2+20.10.17 | EtherCAT Master ECM-V-0120.1 | Firewall FRW-V-0120.0 | GCode GCO-V-0120.2 | InfluxDB IDB-V-0120.0+2.6.1 | IoT Dashboard GDB-V-0120.1+9.3.6 | Key Value Database KVD-V-0120.0 | Modbus TCP MBT-V-0120.1 | Motion MOT-V-0120.3 | Node RED RED-V-120.0+3.0.2-ctrlx | OPC UA Client UAC-V-0120.1 | OPC UA PubSub UAP-V-0120.1 | OPC UA Server UAS-V-0120.1 | PLC PLC-V-0120.1 | PROFINET device PND-V-0120.2 I Python PYR-V-0120.0 |Remote Agent RMA-V-0120.2 | Service Indicator SIN-V-0120.0 | Telegraf Server Agent TSA-V-0118.7 | VPN Client VPN-V-0120.2
DeviceBridge and IDE app versions are fine.
- Mark as New
- Bookmark
- Subscribe
- Mute
- Subscribe to RSS Feed
- Permalink
- Report Inappropriate Content
06-15-2023 02:30 PM - edited 06-15-2023 02:33 PM
- Mark as New
- Bookmark
- Subscribe
- Mute
- Subscribe to RSS Feed
- Permalink
- Report Inappropriate Content
06-19-2023 04:26 PM
New week same red lights, but this time the HMI will reload and it appears that internal logic does execute......but still no web interface to the core.
Has to be something with the 1.20 firmware, it ran fine all last week from Tuesady to Friday some time between late friday afternoon and Monday morning an error of somesort occurs. Maybe I need to look into dsiplaying the log or some sort of error through the HMI project.
- Mark as New
- Bookmark
- Subscribe
- Mute
- Subscribe to RSS Feed
- Permalink
- Report Inappropriate Content
06-20-2023 08:26 AM
This could be a known bug in the pre-release versions of 1.20 that we are currently working on.
Did you switch your logbook to persistent (recommended to use for testing purposes only) and could add the export or system report after error occurs here?

- Mark as New
- Bookmark
- Subscribe
- Mute
- Subscribe to RSS Feed
- Permalink
- Report Inappropriate Content
08-14-2023 03:11 PM
Update:
I am still getting unresponsive behavior after the unit sits idle over weekends, I have also seen it go unresponsive while we are activaly working with it (mostly doing WebIQ stuff). LED conditions are not alwasy the same, this morning it was flashing red but I have seen it solid and flashing blue while unresponsive; even though we had not set it to Maintenance.
Log is set to persistent but nothing appears to have been retained through the power cycle, setting search to last month still only shows 48 entries, all from this morning starting after the power cycle.
- Mark as New
- Bookmark
- Subscribe
- Mute
- Subscribe to RSS Feed
- Permalink
- Report Inappropriate Content
08-16-2023 07:41 AM - edited 11-15-2023 09:32 AM
Just to be sure:
- OPCUA Client is now 1.20.1?
- Does the RAM utilisation increase over time?
- Time and date settings are set to current?
- Logbook is set to persistent and setting is saved?
- Mark as New
- Bookmark
- Subscribe
- Mute
- Subscribe to RSS Feed
- Permalink
- Report Inappropriate Content
11-15-2023 09:33 AM
@MrAdam1983 Any news here? is this still an issue? Or can this topic be closed?

