FORUM CTRLX AUTOMATION
ctrlX World Partner Apps for ctrlX AUTOMATION
Dear Community User! We have started the migration process.
This community is now in READ ONLY mode.
Read more: Important
information on the platform change.
- ctrlX AUTOMATION Community
- Forum ctrlX AUTOMATION
- ctrlX CORE
- ctrlX CORE stops working suddenly
ctrlX CORE stops working suddenly
- Subscribe to RSS Feed
- Mark Topic as New
- Mark Topic as Read
- Float this Topic for Current User
- Bookmark
- Subscribe
- Mute
- Printer Friendly Page
- Mark as New
- Bookmark
- Subscribe
- Mute
- Subscribe to RSS Feed
- Permalink
- Report Inappropriate Content
05-22-2023 01:01 PM - edited 05-22-2023 01:56 PM
Hi,
Our ctrlX CORE device sometimes show abnormal behaviour. Following are some the observations regarding this issue so far:
- We can ping ctrlX CORE device but it's not reachable via browser.
- We have noticed that the PLC app, Cedalo MQTT broker, and python scripts are still running in the background but Node-RED app is not working.
Questions:
- How to troubleshoot this issue?
- What may be the reasons for this problem?
Please find attached the screenshot of browser trying to access PLC. Also find attached the ctrlX CORE system report and diagnostics files.
Solved! Go to Solution.
- Mark as New
- Bookmark
- Subscribe
- Mute
- Subscribe to RSS Feed
- Permalink
- Report Inappropriate Content
05-22-2023 03:12 PM
Hi,
What I would try:
- Reboot the device
- Delete the browser cache and refresh
Best regards,
Nick
- Mark as New
- Bookmark
- Subscribe
- Mute
- Subscribe to RSS Feed
- Permalink
- Report Inappropriate Content
05-22-2023 03:26 PM
Hi Nick,
Thanks for the message. But I don't think that cache of browser is responsible for this problem since I have tried to open the ctrlX CORE from another PC as well that is in the same local network. Furthermore, the Node-RED app is also not working at the back-end so there is some issue at the ctrlX CORE device side.
Some more information:
Manual rebooting of ctrlX CORE device is not a solution since the device has to be operational 24/7 hours of a week. Furthermore, the device is installed at a remote place so manual ON/OFF is not an option. There should be a feature to restart the device via SSH in such cases to handle the problems.
Regarding the issue of ctrlX CORE being not reachable, there are couple of pre-released versions of apps installed in device. So, can they cause a problem? Thanks
- Mark as New
- Bookmark
- Subscribe
- Mute
- Subscribe to RSS Feed
- Permalink
- Report Inappropriate Content
05-22-2023 04:26 PM
The only quite not fitting app on your system is the IDE 1.18.7. There it could be that is trying to acces interfaces not existing on the used apps like ctrlX MOTION 1.12.8, CTRLX CORE Python runtime 1.12.4 and ctrlX AutomationCore 1.12.8.
The only problem that I know that gets device get slow and at some point unreachable is 100% filled up internal RAM or flash storage. Are there e.g. files writiten via Node-RED? Could you do a reboot of the control and afterwards have a look to the CPU and storage utilisation?
You can restart the ctrlX CORE even via its web UI (not needing any ssh connection). See this post if it it is really necessary to get ssh access to your control.
- Mark as New
- Bookmark
- Subscribe
- Mute
- Subscribe to RSS Feed
- Permalink
- Report Inappropriate Content
05-22-2023 05:23 PM
Hi @CodeShepherd,
Thanks for the response.
We'll go for the SSH user as a last option and for now try to restart device and fix issue.
I have just found one interesting point and it might be causing the internal memory to be 100% filled. The diagnostic log I have attached contains 10000 logs that are generated within 40 seconds. That's like a flood of messages and most of them are the repeatation of 2 lines below. I think once the device will start, the diagnostic log memory will be cleaned. This issue might be related to IDE. I'll check and update here. Please let me know if you find a potential reason of repeatation of below logs. Thanks
- 2023/05/19 12:03:11 POST /license-manager/api/v1/license AcquireLicense 5.58392ms
- 12:03:11 ERROR /var/jenkins/workspace/common.licensing/private/src/flx2go/Flx2GoHelperFunctions.c:33: : category - public, code - 0x7000000b (Requested feature was not found.), system - 0x00000000, location - 0x000702c7
- Mark as New
- Bookmark
- Subscribe
- Mute
- Subscribe to RSS Feed
- Permalink
- Report Inappropriate Content
05-23-2023 09:40 PM - edited 05-23-2023 09:41 PM
Hi,
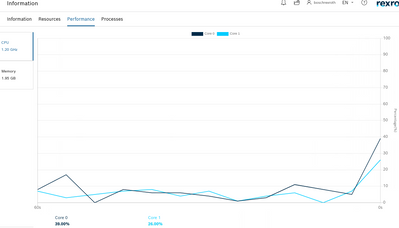
The issue with repeation of error logs at high speed seems to be cleared for now after changing the MQTT broker app version from 2.0.17 to 2.0.16. We'll continue to check the performance of device with current setup. Please see the Storage and CPU Performance screenshots of device below.
- Mark as New
- Bookmark
- Subscribe
- Mute
- Subscribe to RSS Feed
- Permalink
- Report Inappropriate Content
05-24-2023 07:19 AM
The logbook itself is designed as a ring buffer and will not grow excessively. In standard it will also be cleared while reboot if persistence was not switched on manually.
Please keep an eye on CPU, RAM and Flash utilization as working on maximum load in one of each could cause problems.


