
- Subscribe to RSS Feed
- Mark as New
- Mark as Read
- Bookmark
- Subscribe
- Printer Friendly Page
- Report Inappropriate Content
The IoT Dashboard App is based on the Open-Source-Software Grafana for dashboards adapted for ctrlX AUTOMATION. Grafana™ is a trademark registered / owned by Grafana labs, which is not affiliated with and does not endorse the ctrlX CORE App.
With heat maps, diagrams and histograms, data from various data sources and applications can be visualized and analyzed on dynamic dashboards. For this purpose, Grafana offers a variety of plugins to connect the common systems, such as InfluxDB directly.
The dashboard in the Grafana application supports multiple panels in a grid and multiple data sources can be visualized at the same time. In the IoT environment, one focus of the software is on the display of data from numerous time series databases for the analysis of measured values, for example.
Key Features
- Panels – From heatmaps to histograms, graphs to geomaps. Grafana offers fast and flexible visualizations
- Alerts – Create, manage and silence all your alerts easy with a simple configuration
- Transformations – Allows you to rename, summarize, combine, or perform calculations across all data streams
- Annotations – Annotate graphs with rich events from different data sources
- Panel editor – Easy way to configure, customize and explore all your panels
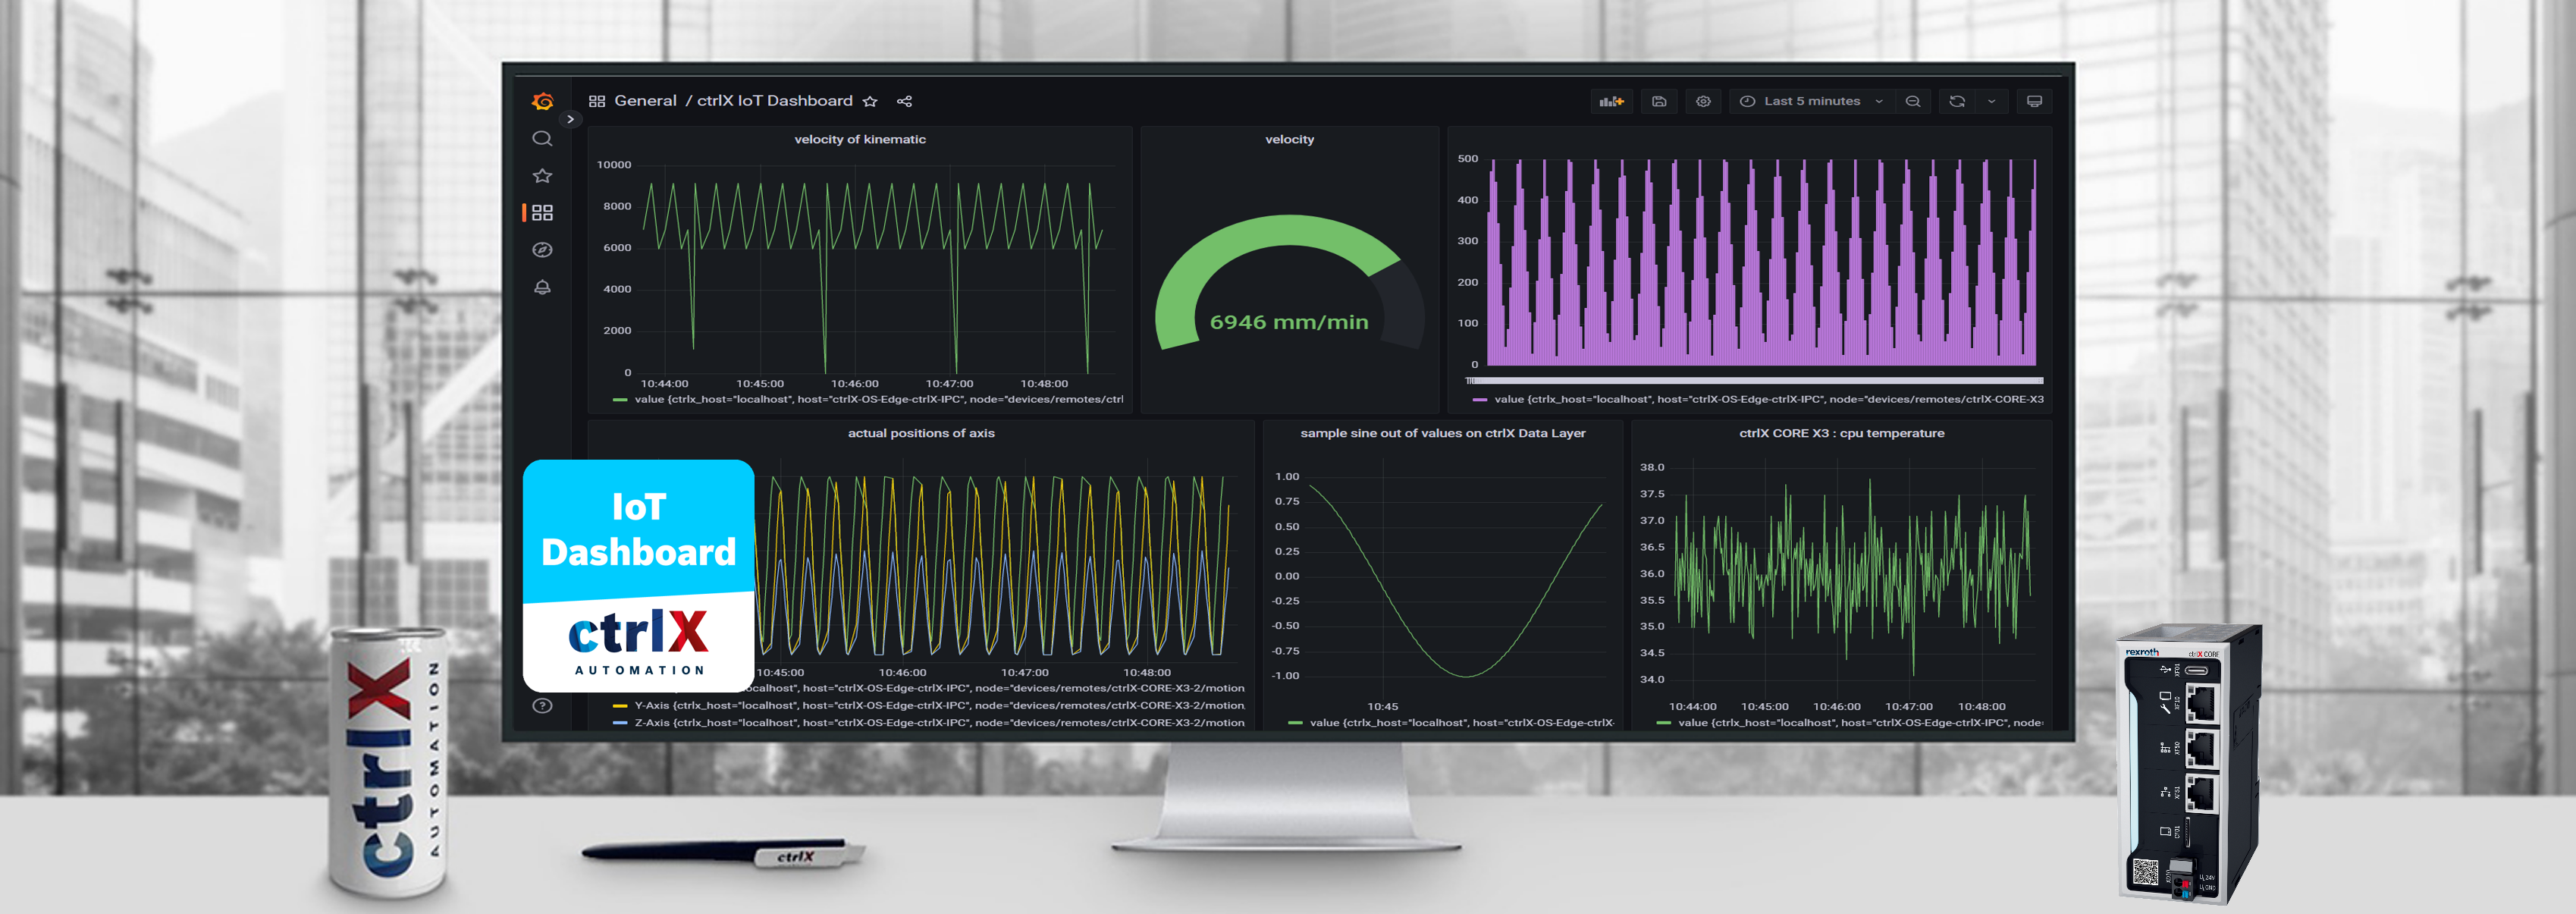
 ctrlX IoT Dashboard - Overview
 ctrlX IoT Dashboard - Edit Panel / Query
 ctrlX IoT Dashboard - Edit Panel / Alert
 ctrlX IoT Dashboard - Configuration / Data Sources
The most important function is the dynamic visualization in real time of data, measured values or log files. Using the graphical dashboards, all important information can be displayed very clearly with predefined or user-defined widgets. The dashboards can be flexibly configured by the user, contain interactive functions and work dynamically.
With its own plug-in interface, Grafana collects important information from a wide variety of data sources. This data is brought together in one place for further analysis. Numerous filter options support the user.
The extensive functions of Grafana also include an integrated alarm system to alert the user to predefined events. In this way, when defined threshold values are reached or status changes, notifications can be automatically triggered to multiple destinations such as e-mail.
Prerequisites
- ctrlX CORE or ctrlX COREVirtual
Support
Related Links

You must be a registered user to add a comment. If you've already registered, sign in. Otherwise, register and sign in.