
- Subscribe to RSS Feed
- Mark as New
- Mark as Read
- Bookmark
- Subscribe
- Printer Friendly Page
- Report Inappropriate Content
- Introduction
- YouTube Video
- Alerts and Notifications
- Add Alert Rule
- Query Data Source
- Reduce Time Series Data
- Threshold Alert Condition
- Alert Evaluation Behavior
- Add Alert Details
- Alert Notification Configuration
- Add Contact Point
- Notification Policies
- Useful References
Introduction
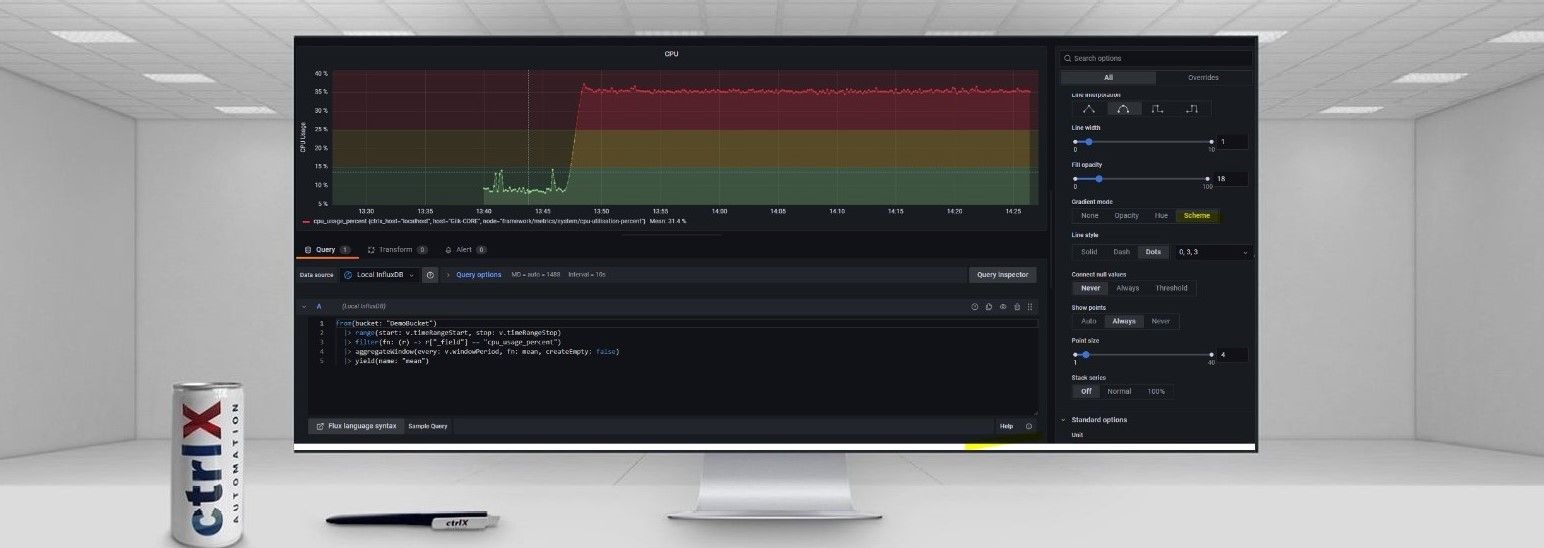
This article provides an overview on configuration of the IoT Dashboard application for the ctrlX CORE. The video covers folder and dashboard management, data source configuration, querying, chart configuration, thresholds, and WebIQ integration, among other topics. Additionally, a section on alerts and notifications is included below.
YouTube Video
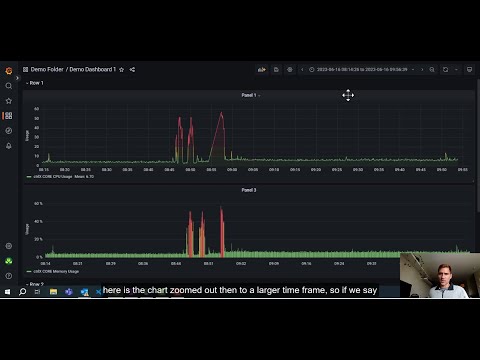
Configuration Guide, Thresholds, Alerts and Notifications
Alerts and Notifications
An example alert and notification will be created below using an InfluxDB data source and posting to a Slack channel. The Grafana documentation is in depth on these topics, so the example will be brief.
Add Alert Rule
Navigate to the Alerting tab. Select Alert Rules and then "+ New alert rule". Finally select "Grafana managed alert".

Query Data Source
In order to evaluate if an alert should be triggered, a data set must first be retrieved. Alerts in Grafana use a seperate query from the dashboards. Use the same process as shown in the video to generate a query from InfluxDB and paste it into expression A.

Reduce Time Series Data
In order to evaluate an alert condition, the time series data set must be reduced to a single value to be checked against. If the 2nd expression labeled B does not exist, select "+Add expression". Select Reduce as the expression type. There are a number of reduction functions to choose from and the Grafana documentation covers these in detail. Select the Max function to follow this example. The Mode field allows you to select how inconsistent data is handled and is also described in the Grafana documentation. Select the Strict mode to follow this example.

Threshold Alert Condition
To trigger an alert, we will compare the reduced time series data set value against a threshold. To create this, select "+Add expression". Choose the expression type as Threshold. Next, select B as the Input which will pull the maximum from the time series data set calculated by the Reduce expression B. The threshold level will depend on the individual application and data set, but in this example a value above 40 will be used. Finally, select "Make this the alert condition" to make this expression trigger the alert.

Alert Evaluation Behavior
Grafana provides a system for pending alerts. If the alert is triggered on each evaluation for the specified duration, the pending alert will become active. To bypass the pending state, enter 0 in the duration field. Under "Configure no data and error handling" behavior on missing data and execution errors can be set. In this example, the Alerting state will be activated in either case.

Add Alert Details
Under the "Add details for your alert" section, a "Rule name" can be set. Also, rules can be organized in folders and placed in groups. Additional information can be included such as a summary, description and alert ID.

Alert Notification Configuration
Finally, labels can be selected to route the alert to specific notification policies. In this example, the Root route will be used which is the default and requires no labeling.

Add Contact Point
In order to produce notifications from the triggered alert, a contact point must be defined. Under the Alerting tab, select Contact points and "+ New contact point". Slack will be used as an example here. Under "Contact point type", select Slack. I use a Webhook URL generated from a Slack app as the endpoint. There are tons of configuration options available under "Optional Slack settings".

Notification Policies
In the Alerting tab select Notification policies. The Root policy will be used here, but specific policies could also be added and routed to using alert labels. Edit the Root policy and select the Slack contact point as the Default contact point. Timing options related to the notification may also be configured here.

Once this policy has been updated, notifications should be recieved in the specified slack channel.

Useful References

You must be a registered user to add a comment. If you've already registered, sign in. Otherwise, register and sign in.