
- Subscribe to RSS Feed
- Mark as New
- Mark as Read
- Bookmark
- Subscribe
- Printer Friendly Page
- Report Inappropriate Content
History
| 10 May 2023 | cx-osci: increase from 2 to 5 x,y curves, add css modifiers hidden, invisible cx-char: add css modifiers hidden, invisible update PLC program |
| 27 Apr 2023 | Initial release |
Prerequisites
- WebIQ Designer version 2.13 or higher
- Basic knowledge of WebIQ Designer
- Plc Engineering 1.12.9 or higher
- Basic PLC programming know how
- Basic JSON know how (optional, when you want to change any chart setting)
Introduction
WebIQ contains a trend element which allows to show trend charts. The smallest recording time is limited by the smallest communication update time. Therefore, with this mechanism you can't display data which changes in a few msec or even less. With this example you get an oscilloscope functionality, where the PLC program:
- Records data (in every PLC cycle)
- Transfers configuration & data via CSV & JSON strings
- Sends it via OpcUA to WebIQ.
- Communication is like a REST API, via command & status strings
In WebIQ the plotly.js library is used to display the data.

Plotly is open-source graphic library (MIT license). Here a list with some features of plotly:
- bar, line, pie, scatter, ... charts
- zoom & pan functions
- configuration of axes, colors, fonts, positions,....
- Online graph maker, which allows you to define & display data and configure the appereance of the chart.
This example is based on 3 elements:
- WebIQ package: package-plotly-basic
- WebIQ package: cx-plotly (provides WebIQ controls to use the plotly functionality)
- PLC example program, which provides x,y data to display and optional configuration strings for plotly
Hint: You should read https://plotly.com/chart-studio-help/zoom-pan-hover-controls/ to get familar how to zoom and pan a chart.
Features
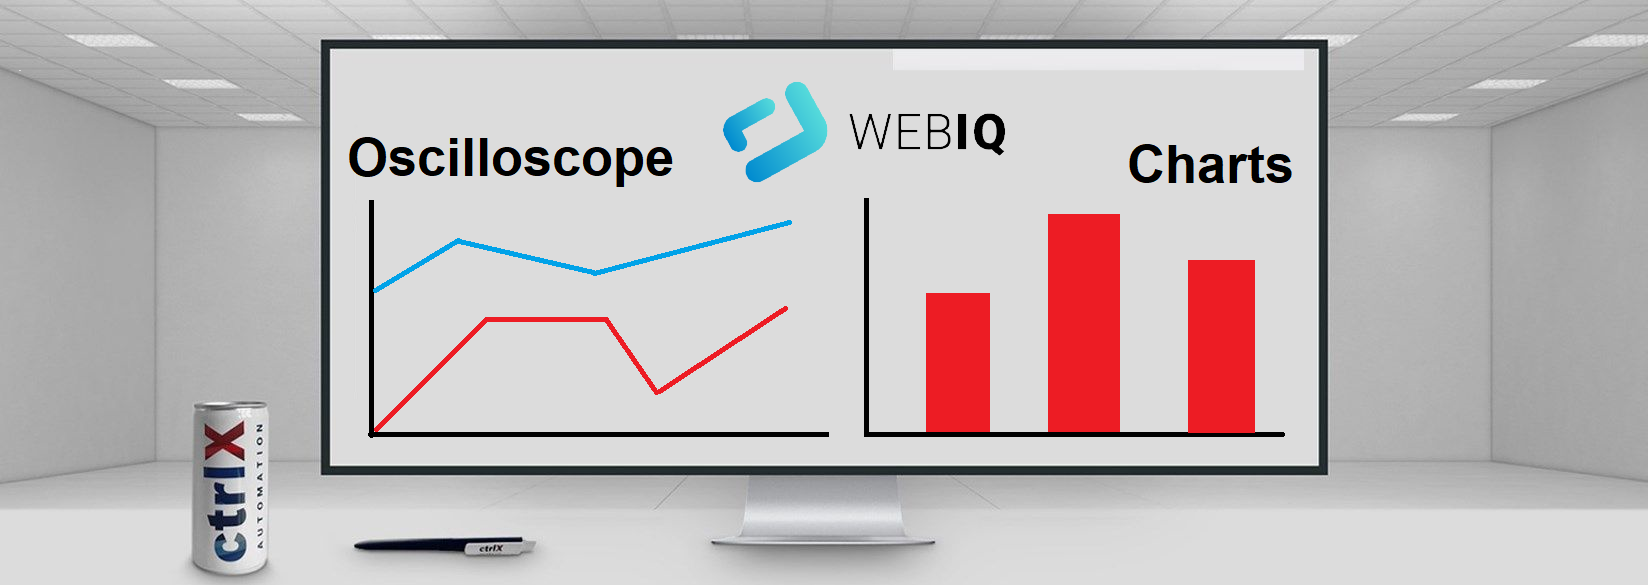
- graphical and table display of recorded data
- widget cx-chart (bar, pie, line)
- widget cx-osci (scatter)
- two data references/ PLC variables
- two y axes with different scales
- configurable titles for all axes
- configurable names of data references
- selectable line style (line, markers)
- zoom, pan
- show/hide of data references
Helpful links
- Plotly home page: https://plotly.com/nodejs/
- Plotly online graph maker: https://chart-studio.plotly.com
Usage of WebIQ demo project Demo-Oscilloscope-Chart-v*.zip
There are 4 tabulators in the WebIQ project.
- Info: provides basic information on the usage of the program
- Oszi data simulated in HMI: displays data, calculated in WebIQ (to allow testing without PLC)
- Oszi data from PLC: displays data, calculated in PLC
(PLC must be connected and run, Check OpcUA settings for a successful communication) - Chart data simulated on HMI
Use functionality in your project
WebIQ
- Add package package-plotly
- Add package cx-plotly
- Insert widget from folder cxGraph and fill in necessary items
To optimize communication, you can set the "Update Interval" of all cx-osci items to "Read once". Only the "Message item" needs cyclic update (e.g. 200ms)
Plc
- Open cx-osci-PLC-example.zip
- Library StringUtils must be included in Plc project
- Adapt start trigger and recorded data in PLC_Prg
- Adapt axes names and titles displayed in the chart in call of mSetup in PLC_Prg
- Configuration of plotly
- If you want to change any of the predefined settings, adapt plotly data, layout and configuration settings JSON string, in PLC_Prg.mSetup.
- Alterntively you can create the string in WebIQ
- To be sure, that the JSON string is formated correctly, use a JSON editor. (e.g. JSON Online editor).
- You can use Plotly Online graph maker to test the possiblities of plotly.
ATTENTION:
You can use WebIQ local variables, to display string in the chart. Ensure, that the content of the local variable does NOT contain any double quote ("), otherwise you get an error while parsing JSON string containing this variable. => chart can not be displayed.
PLC example project contains
- Hints: for implemention data recording and string creation
- String>IL_String: FB for performant string creation
- String>ReplaceAOut: Function for string replacement (to replace variables in a JSON string)
Requested features next versions

You must be a registered user to add a comment. If you've already registered, sign in. Otherwise, register and sign in.