FORUM CTRLX AUTOMATION
ctrlX World Partner Apps for ctrlX AUTOMATION
Dear Community User! We are updating our platform to a new
system.
Read more: Important
information on the platform change.
- ctrlX AUTOMATION Community
- Forum ctrlX AUTOMATION
- SDK
- Re: how to debug and set schedule by sdk
how to debug and set schedule by sdk
- Subscribe to RSS Feed
- Mark Topic as New
- Mark Topic as Read
- Float this Topic for Current User
- Bookmark
- Subscribe
- Mute
- Printer Friendly Page
- Mark as New
- Bookmark
- Subscribe
- Mute
- Subscribe to RSS Feed
- Permalink
- Report Inappropriate Content
10-28-2022 11:27 AM
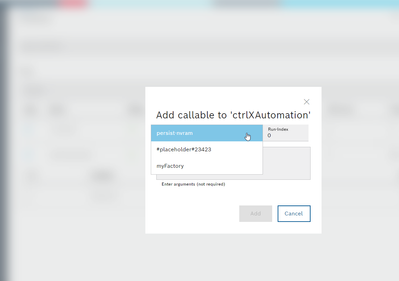
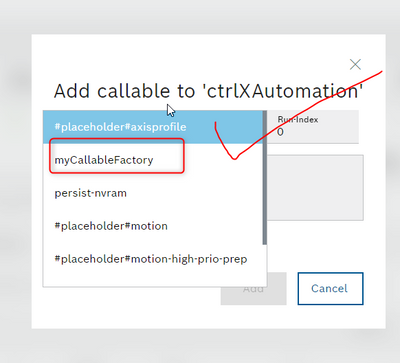
I am a new user to build app by SDK,in my code,I register a callablefactory(myfactory) to scheduler, and then I can chose the callablefactory when the snap installed in my ctrlX CORE ,it work fine
but now I want konw whether I can debug the function of my callable,because,the cycle function writen by
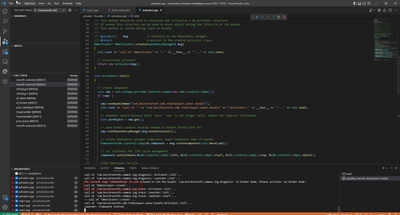
so,I need install app again everytime when I change the callable function now,how can I debug in my app build environments,not in device.it can help me to test function code and convenient to develop the app by SDK
Solved! Go to Solution.
- Mark as New
- Bookmark
- Subscribe
- Mute
- Subscribe to RSS Feed
- Permalink
- Report Inappropriate Content
11-03-2022 07:28 AM
Hello,
it is possible to debug in the build environment. What you are likely missing in your project is a scheduler configuration, which includes the bundle you are creating in your code. That's why your callable did not get created and the execute method didn't get triggered.
Just take a look at the samples we provide (for example automation.scheduler). There is the folder "solutions/activeConfiguration/scheduler". In this folder you have a scheduler configuration. You could use a similar configuration for your bundle, but you would have to change the name of the callable in the programs.json (from HelloCallableFactory to your Callable name).
Best regards,
Nick
- Mark as New
- Bookmark
- Subscribe
- Mute
- Subscribe to RSS Feed
- Permalink
- Report Inappropriate Content
11-03-2022 08:45 AM
hello nick:
thank you for the answer,but I have not debug success after change by the example
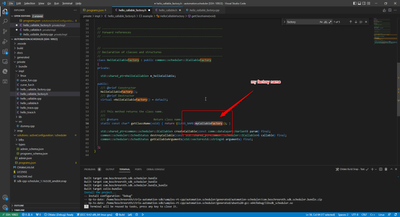
first I change the callablefactory name of scheduler sample,
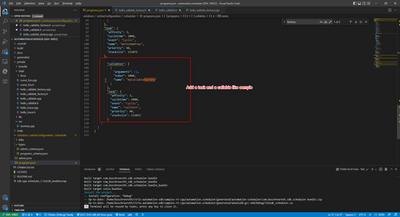
second,I change the name of callable in programs.json(solutions/activeConfiguration/scheduler)and I also add a task like the sample
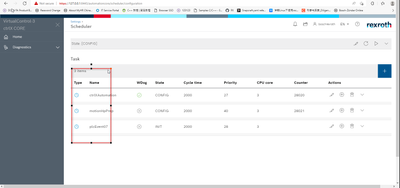
then I bulid and run build task ,inatall the app again,but the scheduler cannot automatic add task or add callable in the task(ctrlXAutomation which already exist) I can found my callable normally ,I need add it by myself.
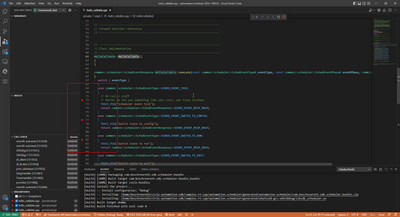
finally ,I start debugging "Framework x64"
- Mark as New
- Bookmark
- Subscribe
- Mute
- Subscribe to RSS Feed
- Permalink
- Report Inappropriate Content
11-03-2022 09:05 AM
I think you are mixing to things here. There are two ways to test your bundle.
- You can install the snap on a real or on a virtual ctrlX CORE. Here you would set the scheduler configuration manually in the webinterface and add your callable. Here you can take a look at the trace logs in the logbook and check if your callable works like you would expect. But you can't hit any breakpoints here.
- You can debug your bundle inside your build environment. For this type of debugging you don't need a ctrlX CORE or ctrlX CORE virtual! Here you don't have a webinterface for the scheduler. To add a configuration here you would need to insert a configuration for the scheduler like you will find in our samples (solutions/activeConfiguration/scheduler).
Hint: This is the same kind of configuration you can also find in the app data of a ctrlX CORE. So you could also download the app data of a ctrlX CORE when you did the debugging type 1 and bring it to the build environment for the type 2.
- Mark as New
- Bookmark
- Subscribe
- Mute
- Subscribe to RSS Feed
- Permalink
- Report Inappropriate Content
11-03-2022 09:38 AM
ok!!! it is a best news of the way 2 in this month(For this type of debugging you don't need a ctrlX CORE or ctrlX CORE virtual!)
I very very want know the way how to hit the breakpoint which in the exectue method.or tell me "it can't achive, you can't hit the breakpoint in " the type 2 just like the a virtual ctrlX CORE without the webinterface? the understand is right? so I cannot test the method in my bundle inside?Can't be tested individually, only as a whole bundle?
actually,what I want to know is how to debug the method which provide by other serve(like scheduler ,motion), I build my app by SDK,so it is convenient to us if I can debug in vscode(my build environment),please tell me the detail or some document .
the bad result I think is I need install again and again to test my function.it is the worst news for my team.it means I cannot do the code testing!!!
- Mark as New
- Bookmark
- Subscribe
- Mute
- Subscribe to RSS Feed
- Permalink
- Report Inappropriate Content
11-03-2022 10:01 AM
This type (2) of debugging is already implemented in the RT-SDK! And this was part of your Advanced SDK Training. (I assume you participated in the training, because this is the only way to get the RT-SDK).
You just build the example (e.g. automation.scheduler) and start the debugging. You can see this in the video attached. Of course breakpoints are hit here.
I would guess, that something in your scheduler configuration is not right. And thats why your callable does not get created. Please take a look at the scheduler configuration we provide in the samples or create a scheduler config on a ctrlX CORE (like I mentioned in the post above).
One additional information: Its not possible to debug samples which use the motion app via this way, because the motion-bundles are at the moment not included in the build-environment.


