

- Subscribe to RSS Feed
- Mark as New
- Mark as Read
- Bookmark
- Subscribe
- Printer Friendly Page
- Report Inappropriate Content
This How-to is a continuation of IIoT: Use ctrlX CORE as a monitoring platform using InfluxDB and Grafana and is intended to show how the Grafana dashboard can be integrated into the visualisation of SmartHMI (WebIQ).
Prerequisites
- Node-Red (V02.06)
- Grafana (IoT Dashboard) (V02.06)
- InfluxDB (V02.06)
- WebIQ (V2.15.7)
The other how-to must be carried out beforehand.
Step-by-Step Guide
Step 1: Prepare Grafana
In order for a Grafana dashboard to be integrated, a few settings must be made first.
Therefore go on the ctrlX Landing Page to the path Manage app data > IoT Dashboard > Grafana.ini
In Grafana V02.06 go to Row 342 or search for "allow_embedding" uncomment it and set it to true.

Additional go to Row 559 or search for "enabled anonymous access" uncomment it and set it to true.
Then Restart the Grafana App.
Hint: Set the Update interval in your Grafana Dashboard before you embed it.
Step 2: Grafana
Click on your Dashboard, which you want to share. Click on the dots in the top right corner and select > Share > Embed


Switch off the Slider as shown in the picture to get relative time range. And here just copy the source link (not the complete link which is displayed in the image), e.g.:https://192.168.1.1/grafana........&refresh=auto&panelId=1
Step 3: WebIQ
Go to WebIQ and start a new project there.
Insert the iFrame object.
")
Then insert the copied Source URL

And then trust the certificate.

After that you can publish the dashboard.
And the final result is that you can reach the IoT Dashboard over the WebIQ Visualization.

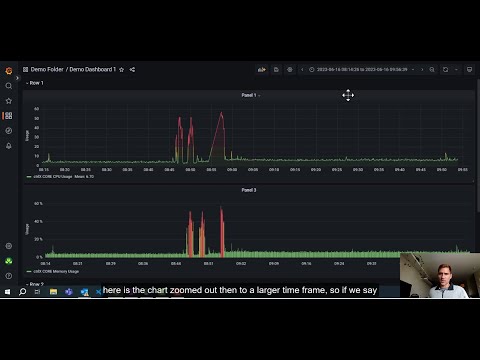
Video of complete setup
This video shows the complete setup of the InfluxDB, IoT Dashboard and also the embedding of the Dashboard into the WebIQ HMI.

You must be a registered user to add a comment. If you've already registered, sign in. Otherwise, register and sign in.