
- Subscribe to RSS Feed
- Mark as New
- Mark as Read
- Bookmark
- Subscribe
- Printer Friendly Page
- Report Inappropriate Content
Overview
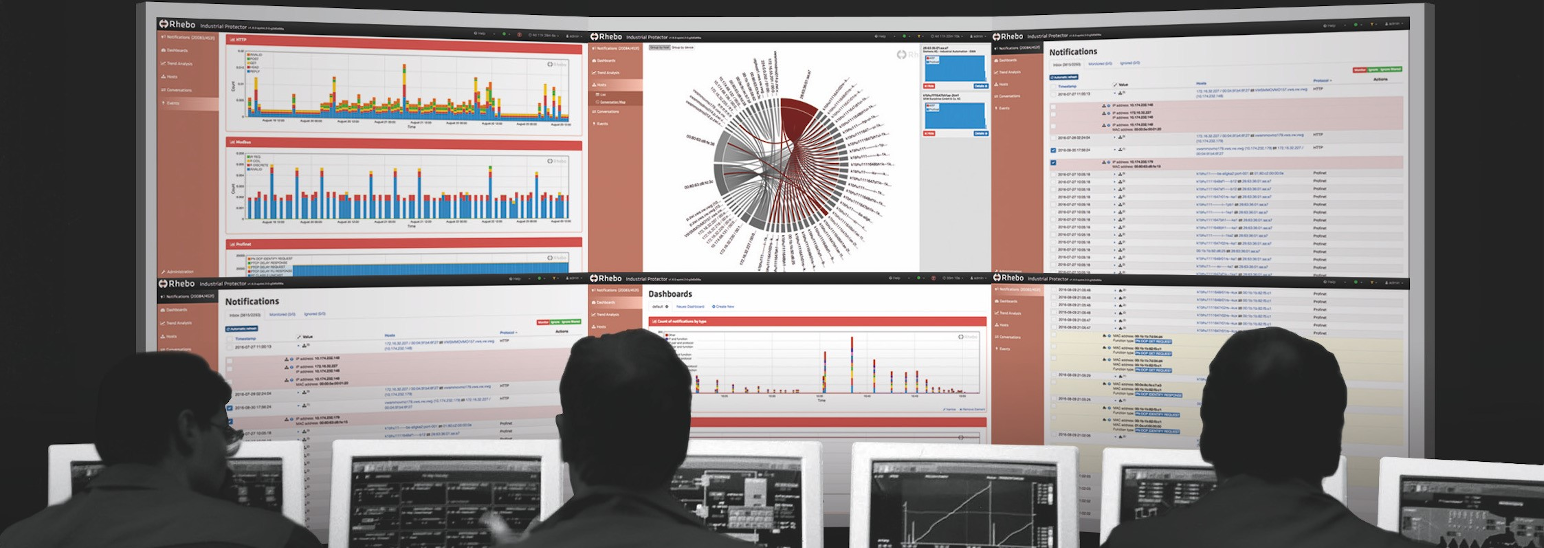
Rhebo enables to monitor and visualize the entire industrial control communication and IACS architecture from shopfloor to SCADA / process control in real-time. The system integrates seamless into existing security and maintenance processes and helps to prevent downtime.


It consists out of a central Rhebo Controller and several Rhebo sensors that are used to monitor the various network segments. For the ctrlX CORE, the "Rhebo - OT Monitoring Sensor" app is available for this purpose. After installing it, the network of the individual machine module can be directly integrated into the monitoring. No further configuration is necessary in the app, it acts as a headless device.

Commissioning
Step 1: Install the "Rhebo - OT Monitoring Sensor" app

In the ctrlX CORE UI, the engineering port XF10 is display as eth0. This port is defined as management port which has to be connected with the Rhebo Controller. The Sensor app monitors currently only the network segment at eth1, which represents the network port XF51. In this example, an additional network adapter wlx7cdd9014e10f is display. It belongs to an USB WiFi Dongle plugged into the ctrlX CORE. This network segment can’t be monitored.

Step 2: Connect the Sensor to the Rhebo Controller
Login to the Rhebo Controller UI. Open the Sensor Management in the Administration menu an click the “Add”-Button. Enter the IP address of the ctrlX CORE eth0, disable the secure communication option and click “Add”. That’s it. Currently, the option secure communication is not supported.


Result
All components connected to the network segment at XF51 / eth1 of the ctrlX CORE are immediately visible in the Network map.

The network traffic can be displayed and analyzed.

Or recorded and analyzed in depth with tools like Wireshark.

Related Links

You must be a registered user to add a comment. If you've already registered, sign in. Otherwise, register and sign in.