FORUM CTRLX AUTOMATION
ctrlX World Partner Apps for ctrlX AUTOMATION
Dear Community User! We are updating our platform to a new
system.
Read more: Important
information on the platform change.
- ctrlX AUTOMATION Community
- Forum ctrlX AUTOMATION
- SDK
- Re: Error when trying to debug according to SDK
Error when trying to debug according to SDK
- Subscribe to RSS Feed
- Mark Topic as New
- Mark Topic as Read
- Float this Topic for Current User
- Bookmark
- Subscribe
- Mute
- Printer Friendly Page
- Mark as New
- Bookmark
- Subscribe
- Mute
- Subscribe to RSS Feed
- Permalink
- Report Inappropriate Content
07-04-2021 02:49 PM
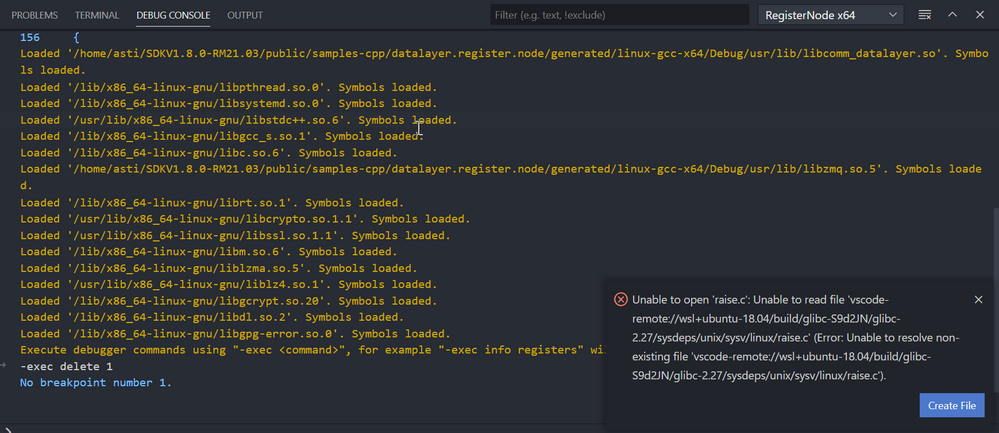
I always get an error (see screenshot) when trying to debug the registernode debug example of SDK 1.8. I followed all steps until "-exec delete 1". But when I want to F10 (step over) I get the message 'unable to open 'raise.c'.
What am I doing wrong?
Is there more information on how to debug a snap?
Please help me 🙂
Thanks
Solved! Go to Solution.
- Mark as New
- Bookmark
- Subscribe
- Mute
- Subscribe to RSS Feed
- Permalink
- Report Inappropriate Content
07-05-2021 09:59 AM
Please beware that attaching to a running app is at the moment still an experimental feature of snapcraft.
At the moment there is a problem when debugging an app that is running on a ctrlX COREvirtual. So I guess it is the same in your case. Please follow this steps:
- Just ignore the raise.c error(s) at the beginning. If they rise.
- Make sure that no breakpoints are set (-exec info b). See GDB cheat sheet for further information.
- Step until all libraries are loaded.
- Add breakpoints and you are good to go
- Mark as New
- Bookmark
- Subscribe
- Mute
- Subscribe to RSS Feed
- Permalink
- Report Inappropriate Content
08-06-2021 09:27 PM
I have observed a similar problem. I'll try to include complete details, so that hopefully someone can reproduce this problem, and/or tell me what I've done wrong.
For this example, I am starting with a clean copy of "samples-cpp/hello.world" from SDK 1.10. I have already configured and tested SSH key-based authentication. The configuration settings below were borrowed/adapted from other SDK examples.
Modify "tasks.json" as follows:
// add to "tasks":

{
    "label": "Launch GDB Server",
    "type": "shell",
    "problemMatcher": "$gcc",
    "command": "ssh ${input:Root-User}@${input:Target-IP} \"sudo snap run --experimental-gdbserver=:12345 helloworld.HelloWorld\" ",
},

// add to "inputs":

{
    "id": "Target-IP",
    "type": "promptString",
    "description": "Remote IP address",
    "default": "192.168.1.1"
},
{
    "id": "Root-User",
    "type": "promptString",
    "description": "Remote user name",
    "default": "myroot"
},
Modify "launch.json" as follows:
// add to "configurations":

{
	"name": "Remote Debug arm64",
	"type": "cppdbg",
	"request": "launch",
	"program": "${workspaceFolder}/generated/linux-gcc-aarch64/Debug/HelloWorld",
	"cwd": "${workspaceFolder}",
	"miDebuggerPath": "/usr/bin/gdb-multiarch",
	"miDebuggerServerAddress": "${input:Target-IP}:12345",
	"stopAtEntry": true,
	"targetArchitecture": "arm64",
	"externalConsole": false,
	"MIMode": "gdb",
	"setupCommands": [
		{
			"description": "Enable pretty-printing for gdb",
			"text": "-enable-pretty-printing",
			"ignoreFailures": true
		}
	]
},
{
	"name": "Remote Debug x64",
	"type": "cppdbg",
	"request": "launch",
	"program": "${workspaceFolder}/generated/linux-gcc-x64/Debug/HelloWorld",
	"cwd": "${workspaceFolder}",
	"miDebuggerPath": "/usr/bin/gdb",
	"miDebuggerServerAddress": "${input:Target-IP}:12345",
	"stopAtEntry": true,
	"targetArchitecture": "x64",
	"externalConsole": false,
	"MIMode": "gdb",
	"setupCommands": [
		{
			"description": "Enable pretty-printing for gdb",
			"text": "-enable-pretty-printing",
			"ignoreFailures": true
		}
	]
},

// add to "inputs":

{
	"id": "Target-IP",
	"type": "promptString",
	"description": "Remote IP address",
	"default": "192.168.1.1"
},
Change the input defaults to match your development environment if you like.
Build the debug snap, and install it on the ctrlX CORE.
In VS Code, open the "Terminal" menu, and select "Run Task". Select "Launch GDB Server". Confirm your remote root user name and remote IP address. You should now see the following in your VS Code Terminal window:
Welcome to "snap run --gdbserver".
You are right before your application is run.
That is followed by instructions for starting GDB manually. Try it, from the WSL command prompt:
$ gdb-multiarch -ex="target remote 192.168.0.123:12345"
At the gdb prompt, type "cont". Doing that repeatedly causes the program to run to completion; you should see the "Hello World" message in the VS Code terminal window. Type "q" to exit GDB.
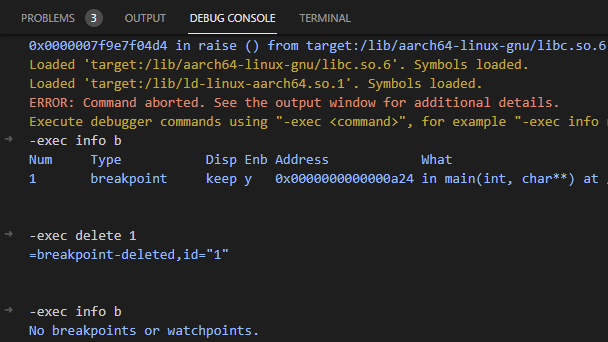
Launch the GDB server again; but this time, connect to it with VS Code: open the Command Palette, select "Debug: Select and Start Debugging", choose "Remote Debug: arm64", and confirm the remote IP address. It will stop on a "raise" call, just as it did previously. However, at least for me, attempting to continue with the F5 key or "-exec cont" repeatedly produces the error:
ERROR: Command aborted. See the output window for additional details.
I can't find anything relevant in the output window.
I'm not sure of what to do next. Any advice would be appreciated.
- Mark as New
- Bookmark
- Subscribe
- Mute
- Subscribe to RSS Feed
- Permalink
- Report Inappropriate Content
08-26-2021 03:56 PM
In general debugging a snap application works. In the SDK we will provide a better documentation.
- Mark as New
- Bookmark
- Subscribe
- Mute
- Subscribe to RSS Feed
- Permalink
- Report Inappropriate Content
08-26-2021 04:01 PM
- Mark as New
- Bookmark
- Subscribe
- Mute
- Subscribe to RSS Feed
- Permalink
- Report Inappropriate Content
08-27-2021 06:26 PM
Thanks. It's now working for me. The important point is to ensure that all breakpoints are deleted before pressing F5 (continue).
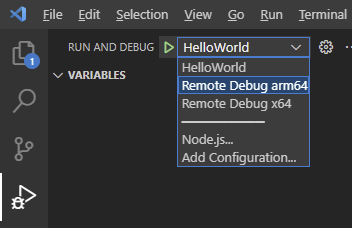
The "Remove All Breakpoints" step ensures that you only need to manually remove one breakpoint.
The "Run and Debug" item is found here:
When the debugger initially connects, the "snap" program is running -- not your application. I don't think Visual Studio Code expects this, and perhaps that's why you have to remove all breakpoints now?
The first three times I press F5, execution stops again inside "snap". The fourth time I press F5, it starts my program. (It says "dash" initially because snap uses wrapper scripts; but a few lines further down, the program starts.)
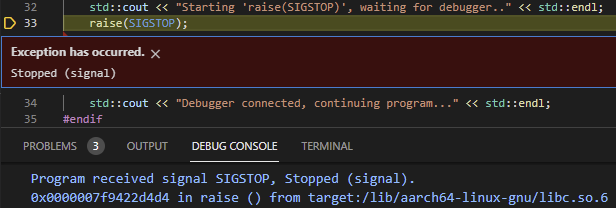
... and stops on the line that calls "raise(SIGSTOP)".
As expected, the Terminal window now displays the "waiting for debugger" message that precedes the "raise(SIGSTOP)" call.
As the documentation states, it's now possible to add breakpoints and continue or step as needed.


